
Passenger Information System: A Practical Guide for 2026
The UK passenger information system market was valued at about $2,502.3 million in 2023 and is projected to reach about $4,243.9 million by 2028, a compound annual growth rate of 11.1% over 2023 to 2028, according to MarketsandMarkets' UK passenger information system market analysis. That investment reflects a practical shift: operators increasingly need one live information layer that connects timetables, vehicle movements, disruption decisions, accessibility requirements and passenger-facing channels.
For the Waymap team, a passenger information system isn't just a screen on a platform. It's the live nervous system of a transport network or venue. It tells people what's happening now, what's likely to happen next and what they should do about it, while giving staff the same operational picture through control rooms, apps, announcements and journey-planning tools.
What a Passenger Information System Actually Does
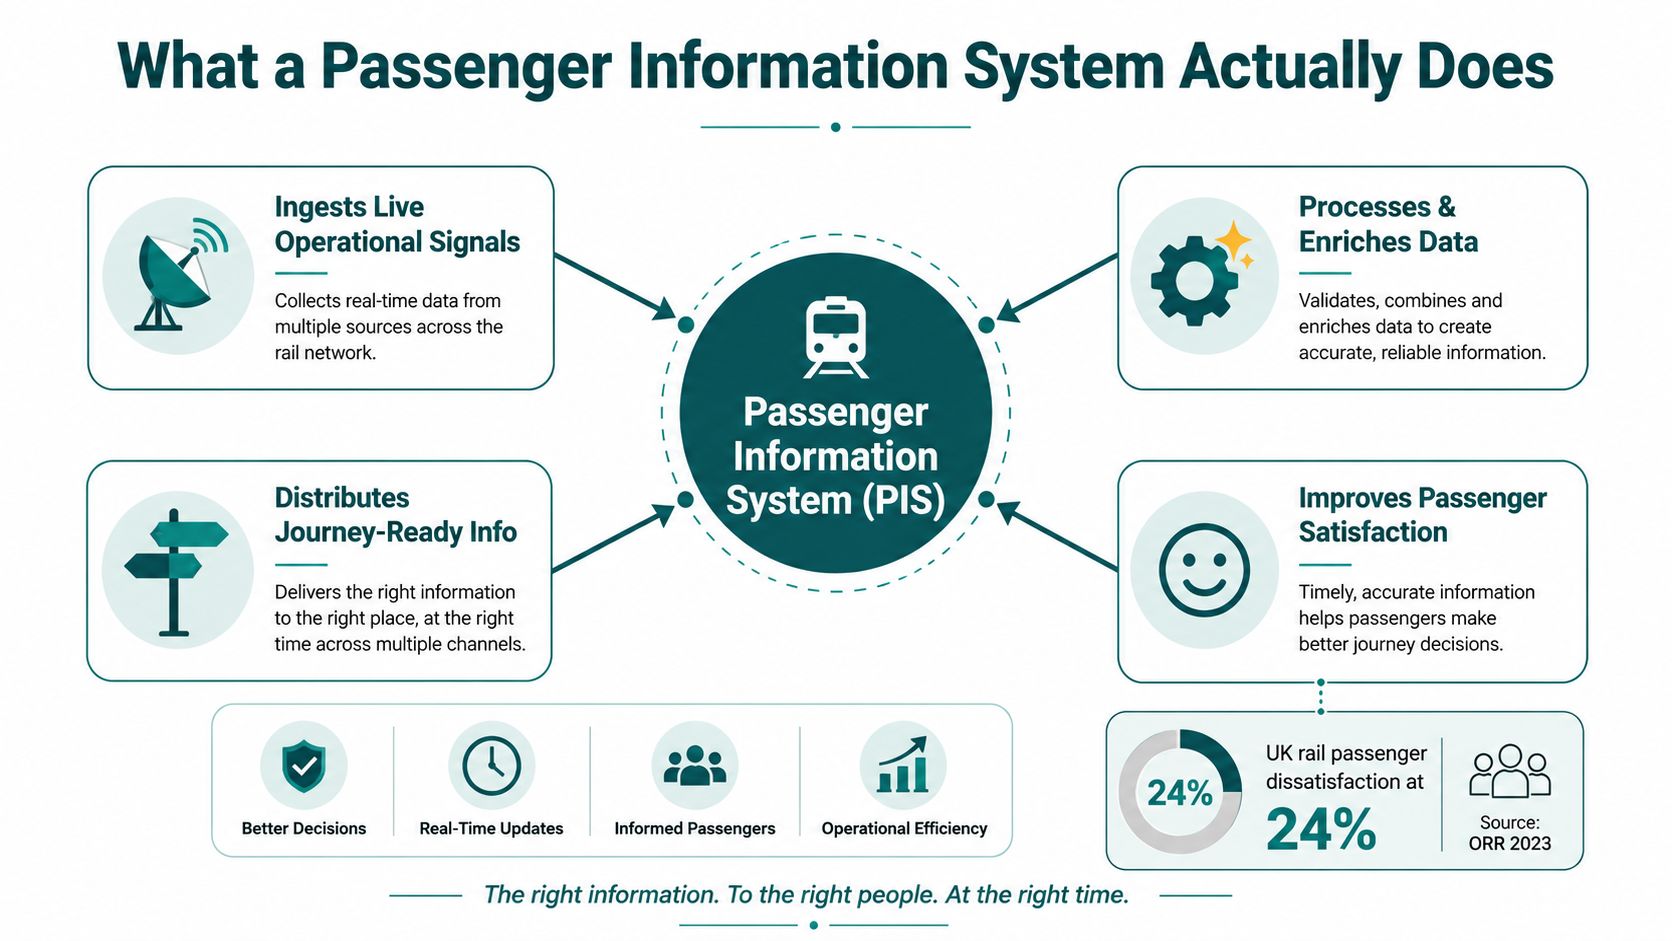
A passenger information system turns operational data into information that travellers can act on. It can compare the planned timetable with live vehicle or service data, calculate predicted arrivals, publish platform or stop changes, issue disruption notices and distribute the result through displays, audio, websites, apps and machine-readable feeds.
That makes it a decision tool, not merely a communications channel. A commuter may need confirmation that a train is approaching. An occasional traveller may need to know which platform to use and whether a connection remains realistic. A passenger with access requirements may need an audible announcement, a visible destination, a step-free route or clear instructions after a lift failure.
A useful PIS answers three questions:
- What's happening now? Is the service on time, delayed, cancelled, diverted or replaced?
- What's likely next? When will the vehicle arrive, where will it stop and which connection may be affected?
- What should I do? Should the passenger wait, change platform, use a replacement coach, leave through a particular exit or choose another route?
What sits inside the system boundary
The PIS normally owns the transformation and publication of passenger-facing information. It may ingest data from:
- Automatic Vehicle Location systems, which provide the position of buses or other vehicles.
- Timetable and stop databases, which define the planned service.
- Control-room systems, where staff record incidents, cancellations and operational decisions.
- Station or venue management systems, which provide platform, entrance, facility or event information.
- Accessibility data, including information needed for audible, visible or alternative-format communication.
The PIS doesn't necessarily own ticketing, fare collection, fleet dispatch or building management. Those platforms remain adjacent, but their data becomes useful when the passenger information layer gives it a consistent, understandable form. The same principle applies to real-time information in transport, where accuracy depends on both the underlying feed and the way the result is presented.
Venue operators can apply the same boundary logic to entrances, queues, meeting points and emergency communication. A separate guide to visitor management for Perth businesses is useful when a venue needs to connect visitor records and front-of-house processes with wider operational communication.
Core Components and Delivery Channels
A passenger information system has three working layers: a data engine, a content layer and several delivery channels. This separation lets an operator improve one layer without rebuilding the entire service. Together, they form a live nervous system, carrying operational decisions to passengers, staff and connected applications.
The data engine receives planned and live information. It compares schedules with vehicle movement, predicts arrivals, records cancellations and lets authorised staff publish disruption messages. The content layer converts those outputs into usable passenger information, including timetable entries, stop names, journey plans, service notices and accessibility metadata. It functions as a decision tool alongside communications channels, because operators can use the same information to monitor service performance and operational KPIs.
UK systems need a shared reference model rather than a collection of private operator formats. The government's public transport XML standards collection identifies NaPTAN, NPTG and TransXChange as standards used in UK transport passenger information systems. The same material connects the Bus Open Data programme, created under the Bus Services Act 2017, with the requirement for operators to produce TransXChange timetable files.
That structure gives each stop, place and timetable a consistent meaning across the backend, a display, a journey planner and an accessibility service. Without a canonical reference, every integration requires a separate interpretation, increasing the risk that a correct operational update appears differently across channels.
Delivery channels and their trade-offs
Visual channels include platform TFT or LCD displays, e-ink signs, fixed PIS totems, station departure boards and next-stop screens on buses. They are highly visible, but require power, mounting, network connectivity and physical maintenance. Audio channels include public-address systems, onboard announcements and equipment compatible with hearing loops.
Personal channels extend information beyond the station. Mobile apps, websites, SMS and push notifications deliver the same service state to a passenger's own device. Infrastructure-free wayfinding apps can sit alongside legacy signs and public-address equipment, giving people route guidance without new physical installations. Machine channels, including REST APIs, SIRI and websockets, let journey planners and third-party services consume updates directly.
| Component | Primary Channels | Infrastructure Required |
|---|---|---|
| Real-time prediction engine | Displays, apps, APIs, control-room dashboards | AVL or operational feeds, servers or cloud services |
| Timetable and stop reference data | Journey planners, signs, apps, web | NaPTAN, NPTG and TransXChange data |
| Disruption manager | Screens, PA, push notifications, websites | Staff workflow, authorisation and publishing tools |
| Accessibility information layer | Audible announcements, visible displays, apps | Audio equipment, suitable displays and structured metadata |
| Mobile and API delivery | Smartphones, third-party tools, machine clients | API gateway, mobile connectivity and monitoring |
The investment sequence should follow the operational problem. Inaccurate source data will continue to damage passenger trust, even after more screens are installed. Reliable feeds with limited reach may justify improving mobile and API distribution before replacing fixed displays. The principles behind dynamic digital signage also apply here, because flexible content affects the value of the hardware that presents it.
How Real-Time Data Flows Through a PIS
Consider one bus approaching a stop. Its location begins with GPS or another positioning source. The vehicle sends that information through an Automatic Vehicle Location system, which passes a structured update to the processing layer.
The processing engine matches the vehicle to a scheduled journey, identifies the canonical stop and compares the current movement with the timetable. It can then produce an estimated arrival time, a service-status update or a message explaining that the vehicle has been diverted. That result is distributed to displays, applications and third-party systems through formats such as SIRI-VM, GTFS-RT or NeTEx, depending on the deployment and exchange requirement.
Where data quality breaks
Prediction logic can't compensate for a weak reference layer. Common operational faults include:
- Stale schedules, which make a correct vehicle position appear wrong against an obsolete timetable.
- Missing vehicle identifiers, which prevent the engine from associating a live movement with the correct service.
- Timezone drift, which creates misleading comparisons between planned and actual times.
- Unmatched stop references, which can send an accurate prediction to the wrong platform, stop or place.
- Conflicting disruption messages, where a control-room update doesn't reach every output channel.
The UK government's standards framework addresses this problem by establishing shared machine-readable models for stops, places and timetables. The UK PTI material also separates passenger-information equipment data from accessibility-information elements, which signals that systems must preserve both journey content and accessibility metadata as data moves through the platform.
Practical rule: Treat the canonical stop and place model as critical operational infrastructure. A prediction is only useful when the system knows exactly which passenger decision it belongs to.
The feedback loop matters too. A disruption notice may tell someone to use a replacement coach, while staff need visibility of the same decision in the control room and downstream journey planners need the same service state. Real-time transit information works only when the publication layer keeps those contexts aligned.
Accessibility and Compliance in UK Operations
Accessibility needs to be designed into the passenger information system's data, interfaces and operating procedures. The Public Service Vehicles (Accessible Information) Regulations 2023 require audible and visible accessible information on local bus and coach services in England, Scotland and Wales. Relevant information must be provided at each stopping place, and vehicles first used on or after 1 October 2024 must comply from first use. The wider phased rollout runs through 2024 to 2026 for most local bus and coach services, as set out in the regulations published by the UK government.
The technical requirement is more demanding than adding an announcement button. Operators must coordinate audio routing, display placement, contrast, brightness and content timing. The RTIG briefing on the Accessible Information Regulations states that screens should be positioned so the majority of seated passengers have an unobstructed view, while audio must be high enough above background noise to be understood by the majority of seated passengers. On double-deck vehicles, the requirement applies on both decks.
Compliance must account for the fleet
The timetable differs according to vehicle age:
- Vehicles first used on or after 1 October 2024 must comply from first use.
- Vehicles first used on or after 1 October 2019 must comply from 1 October 2024.
- Vehicles first used between 1 October 2014 and 30 September 2019 must comply from 1 October 2025.
- Older vehicles must comply from 1 October 2026.
That mixed fleet means one fixed specification won't be enough during the transition. Compliance teams need an asset register showing which vehicle has which screen, speaker, amplifier, display position and software configuration.
The Office of Rail and Road requires rolling stock and station accessibility information to be kept up to date and published online in a format accessible on a personal mobile device. Alternative print and audio formats must be available on request within seven working days, according to ORR guidance on accessible rail information. EU rail accessibility technical specifications applicable in the UK require station departure information, including destination, intermediate stops, platform number and time, to be displayed at a maximum height of 160 cm in at least one station location, as described in the rail accessibility specification.
For operators, the practical checklist includes:
- Audible output: Confirm announcements remain understandable above background noise.
- Visible output: Check line of sight, contrast, text size and placement for seated and wheelchair users.
- Content consistency: Ensure the audio, screen, app and staff message describe the same service state.
- Operational readiness: Train staff to publish clear accessible disruption messages.
- Alternative formats: Maintain a process for print and audio requests within the required response period.
Emergency communication has a similar human-factors dimension to transport information. Guidance on the role of visitor management can help venue teams think about how information, people flow and incident response interact. For a broader explanation of the Equality Act's relevance to accessible navigation and communication, see Waymap's guide to Equality Act 2010 requirements.
Benefits for Transit Operators and Venue Managers
A PIS creates value when it improves a decision, not only when it publishes a message. For a transport operator, that decision might be whether to wait, re-route, board a replacement service or connect with another route. For a station or venue manager, it might be whether to redirect a queue, open another entrance or communicate a change without sending staff to every information point.
The UK Passenger Information System market's projected growth indicates sustained operator investment in real-time, multi-channel information across rail, bus and other transport settings. The operational case should still be built around local measures, such as prediction accuracy, passenger contacts, missed connections, platform crowding and accessibility complaints, rather than market growth alone.
The same backbone supports different teams
A control room needs event creation and escalation. A passenger needs a short, unambiguous instruction. A venue manager needs information linked to entrances, facilities, zones and staff actions. One governed data layer can support all three without forcing every team to maintain separate messages.
| Benefit Area | Transit Operators | Venue and Station Managers |
|---|---|---|
| Service clarity | Align predictions, cancellations and connection advice | Direct visitors to entrances, facilities and event zones |
| Disruption response | Publish one incident state across screens, audio, apps and APIs | Coordinate queues, closures and alternative routes |
| Accessibility | Provide audible and visible information with relevant metadata | Offer multi-format guidance through fixed and personal channels |
| Staff efficiency | Reduce repeated manual explanations when channels are synchronised | Give front-of-house teams a shared operational picture |
| Performance management | Compare planned service with passenger-facing outcomes | Review crowd movement, information demand and incident handling |
Static signage remains useful for stable information, such as permanent entrances or safety instructions. It becomes weak when a platform changes, a lift fails or a replacement coach departs from an unusual location. Dynamic PIS channels can update the message, but only if staff have approved workflows and the underlying stop, place and facility data is dependable.
Disruption is where the passenger decision problem becomes most visible. UK rail has launched real-time disruption maps that publish incident updates within 30 minutes, with subtitles and British Sign Language where possible, according to the Department for Transport's passenger and service information direction. At the same time, the Department for Transport has created temporary exemptions for unplanned rail replacement coaches because full accessible information compliance can't always be guaranteed at short notice, alongside funding for transferable audio-visual equipment.
That combination points to a KPI beyond “alert sent”. Operators should ask whether passengers received the same actionable instruction across regular rail, replacement coach and disrupted service contexts.
Integration Options Including Infrastructure-Free Wayfinding
A passenger information system can combine existing hardware with software channels, so operators can extend passenger coverage without replacing an entire estate. Fixed displays and public-address equipment still serve shared spaces, while apps and APIs deliver information to people beyond those physical points.
A typical UK integration uses SIRI for real-time service information, TransXChange for scheduled timetables and GTFS for multi-modal publication. Rail deployments may also consume the Darwin push data feed used by Network Rail. An open API layer can connect these sources with AVL streams, platform CIS controllers, crowd-density sensors and third-party journey planners. The integration layer functions like a nervous system, carrying operational changes to the channels passengers use. Guidance on connecting separate enterprise systems is available in EAI explained for businesses.
Match the channel to the passenger decision
A platform display works when many people need the same departure information. An app suits an individual who needs directions from street level to a platform, exit or venue destination. Audio supports passengers who cannot use a visual display, and APIs let other services reuse the operator's current information.
The physical setting and passenger task should determine the channel:
- Fixed CIS displays: Provide shared visibility, but need mounting, power, connectivity and maintenance.
- PA systems: Deliver immediate announcements, while acoustics, volume control and consistent scripts affect their usefulness.
- Hybrid channels: Keep station hardware in service while synchronising app and web content through common APIs.
- Cloud-native publication: Add distribution channels quickly when security, availability and data governance are designed into the service.
- Personal wayfinding: Use the passenger's own device for guidance through complex indoor or underground spaces.
Infrastructure-free wayfinding extends the reach of a PIS by adding personal guidance where fixed displays cannot direct an individual passenger. Waymap uses device-native motion sensors and detailed maps to provide step-by-step audio directions indoors, outdoors and underground without relying on GPS, Wi-Fi or installed hardware. It can operate alongside PIS-managed corridors, lifts, platforms and exits, helping a passenger follow the correct turn when a shared display cannot provide that level of detail.
This arrangement suits operators managing changing layouts or sites where beacon installation and maintenance would create an ongoing operational burden. The PIS remains the shared operational layer, while the app supplies individual guidance through the same facilities and routes.
Implementation Best Practices and KPIs
Treat a PIS rollout as a service-improvement programme, not a signage purchase. Start by mapping the current AVL, timetable, stop, disruption and accessibility feeds against what passengers receive at platforms, stops, onboard locations, websites and mobile devices.
Use a staged deployment model
A practical sequence is:
- Audit the data foundation: Check NaPTAN, NPTG and TransXChange references, vehicle identifiers, timetable freshness and the ownership of each feed.
- Map passenger decisions: Identify where people need arrival predictions, platform changes, replacement instructions, accessible routes or facility status.
- Prioritise channels: Improve software distribution and mobile access where those channels can address gaps before replacing fixed displays.
- Pilot a corridor or site: Test prediction accuracy, audio synchronisation, display visibility, disruption workflows and accessibility coverage in a controlled area.
- Scale through governance: Assign owners for data freshness, incident communication, content review, supplier access and service monitoring.
A pilot should include real operational scenarios, not just normal running. Test a late vehicle, a platform change, a lift outage, a short-notice replacement coach and a message that must appear in both audible and visible formats. Record whether the same instruction reaches staff, displays, apps and APIs.
Build a KPI set that operators can manage
Some targets belong in the business case, while others should be established during the pilot. The following table gives a workable structure without pretending that one benchmark suits every network.
| KPI | Target Benchmark | Data Source |
|---|---|---|
| Predicted versus actual arrival accuracy | Set a route-specific threshold during the pilot, with above 85% as the proposed benchmark | AVL, timetable and PIS event logs |
| Audio announcement coverage | Define complete coverage for required services, vehicles and stopping places | Audio controller logs and fleet compliance records |
| Accessible information availability | Track publication in required audible, visible and alternative formats | PIS content audit and accessibility request records |
| Disruption message consistency | All authorised channels should carry the same active service state | Incident-management and channel delivery logs |
| Passenger satisfaction | Establish a baseline and monitor change through structured passenger surveys | Passenger feedback and survey programme |
| Accessibility complaints | Track volume, category, response time and unresolved cases | Customer-contact and complaints systems |
| Display and API availability | Set a service-level threshold appropriate to each channel | Monitoring, device health and API logs |
The above 85% proposed arrival-accuracy benchmark belongs in a local measurement framework, not as a universal industry fact. Teams should segment results by route, stop, time period and disruption type, then feed the findings into timetable planning, staff training and capital-investment decisions.
Governance also needs a review cycle. Audit content for clear language, accessible formatting, correct stop references and consistent instructions. Maintain fallback procedures for outages, and protect the PIS through controlled publishing access, network separation, update validation and monitoring of third-party integrations.
Practical guidance on passenger information system implementation best practices can support that programme design.
Waymap provides a complementary, infrastructure-free navigation layer for passenger information systems, with step-by-step audio guidance through transport hubs to platforms, exits and destinations using a passenger's own smartphone sensors. Visit Waymap to assess how personal wayfinding could connect with your existing PIS, accessibility data and station or venue routes.
