
How to Measure Cost Savings for Venues and Transit Operators
A board meeting rarely turns on whether an accessibility or wayfinding project sounds worthwhile. It turns on whether you can answer one question: how to measure cost savings in a way that survives scrutiny. Venue and transit managers are often asked to prove a reduction in spend while also accounting for avoided infrastructure, accessibility outcomes, service quality, ESG value and potential revenue impact. A credible case therefore needs more than a favourable year-on-year comparison. It needs a documented baseline, a realistic counterfactual, validated data, transparent formulas and a clear distinction between cash-releasing and non-cash-releasing value.
Why Measuring Cost Savings Is Harder Than You Think
The challenge usually appears when a manager presents a neat savings figure and a finance director asks, “Compared with what?” The figure may combine reduced signage replacement, fewer staff interventions, avoided hardware installation and improved visitor experience, but if those benefits weren't defined before implementation, the calculation can look like advocacy rather than evidence.
That problem affects public bodies especially. HM Treasury's Government Efficiency Framework requires cash-releasing efficiency savings to use quality data, baseline cost information, a counterfactual spending profile and outturn spending data. Savings must be reported net of costs in the financial year in which they're realised, remain sustainable, be scored only once and be supported by calculations an impartial third party would consider reliable, reasonable and verifiable. The framework applies to departments from the 2023/24 financial year and arm's-length bodies from 2024/25.
The board needs more than a cheaper invoice
A venue may not reduce its facilities budget after replacing static signs with a digital wayfinding layer. It may avoid future signage changes, reduce pressure on information desks, improve access to rooms or platforms and strengthen its response to accessibility obligations. Those outcomes matter, even when they don't appear as an immediate cash reduction.
UK parliamentary reporting records that central government began measuring financial efficiency savings and wider benefits in 2021. It reports £3.4 billion of cash-releasing savings in 2020–21, followed by £3.4 billion of cash-releasing savings and £1.0 billion of non-cash-releasing savings in 2021–22. The distinction is important for any operator reporting to a board, public authority or funding body.
Practical rule: A savings claim should be understandable to someone who wasn't involved in the project and should still make sense after implementation costs are deducted.
Infrastructure-free navigation changes the cost profile before the first benefit is counted. Waymap uses device-native motion sensors and dead reckoning rather than GPS, Wi-Fi or installed beacons, so the business case can compare a navigation service with the capital and maintenance burden of physical infrastructure. The operational context is also discussed in Waymap's facilities management analysis, which is useful when separating recurring facilities costs from broader service value.
Establishing Your Baseline and Defining Objectives
You can't measure a saving until you've defined the cost of doing nothing. HM Treasury's method calls this the counterfactual spending profile, meaning the documented estimate of what would probably have happened without the intervention.
Build it before comparing actual results. Start with historical invoices, purchase orders, staffing records, maintenance logs and approved budgets. Then adjust for known changes such as a new building, a revised service contract, altered opening arrangements or a planned signage replacement. A simple prior-year comparison is rarely sufficient because it can confuse a genuine efficiency with lower demand, delayed work or a budget transfer.
Match the baseline to the procurement scenario
The baseline must reflect the decision being tested, not whichever number produces the largest apparent saving. UK procurement benefits guidance gives three useful rules:
| Scenario | Baseline method | Source requirement |
|---|---|---|
| Replacement contract | Compare with the previous delivered price at the end of the last contract | Final contract price and delivered scope |
| Collaborative agreement without a prior collaborative baseline | Agree a common sector or cross-sector baseline | Documented benchmark accepted by participating organisations |
| No existing agreement | Use the average price of the top five acceptable compliant bids | Tender records and compliance assessment |
A venue evaluating digital wayfinding should also record the alternative it would have funded. That might be renewed signage, additional assistance-desk coverage, beacon hardware, wiring, mapping work or a combination. A transit operator such as SBS Transit would need to distinguish between a new navigation layer and costs that the operator would have incurred anyway through station refurbishment.
Define the objective before choosing the measure
Write the objective in operational terms. “Reduce accessibility costs” is too broad. A stronger objective might be to avoid recurring physical wayfinding changes, reduce preventable staff interventions or improve independent access to specific destinations while preserving service quality.
Budget approval cycles create a particular problem for NHS estates teams and large venues. Capital restrictions can make beacon infrastructure, wiring and hardware politically difficult even when the accessibility need is clear. A system based on smartphone sensors and detailed maps removes those installation dependencies, but the avoided capital must still be recorded as a counterfactual, not presented automatically as realised cash.
Choosing the Right Metrics Beyond Cash Reduction
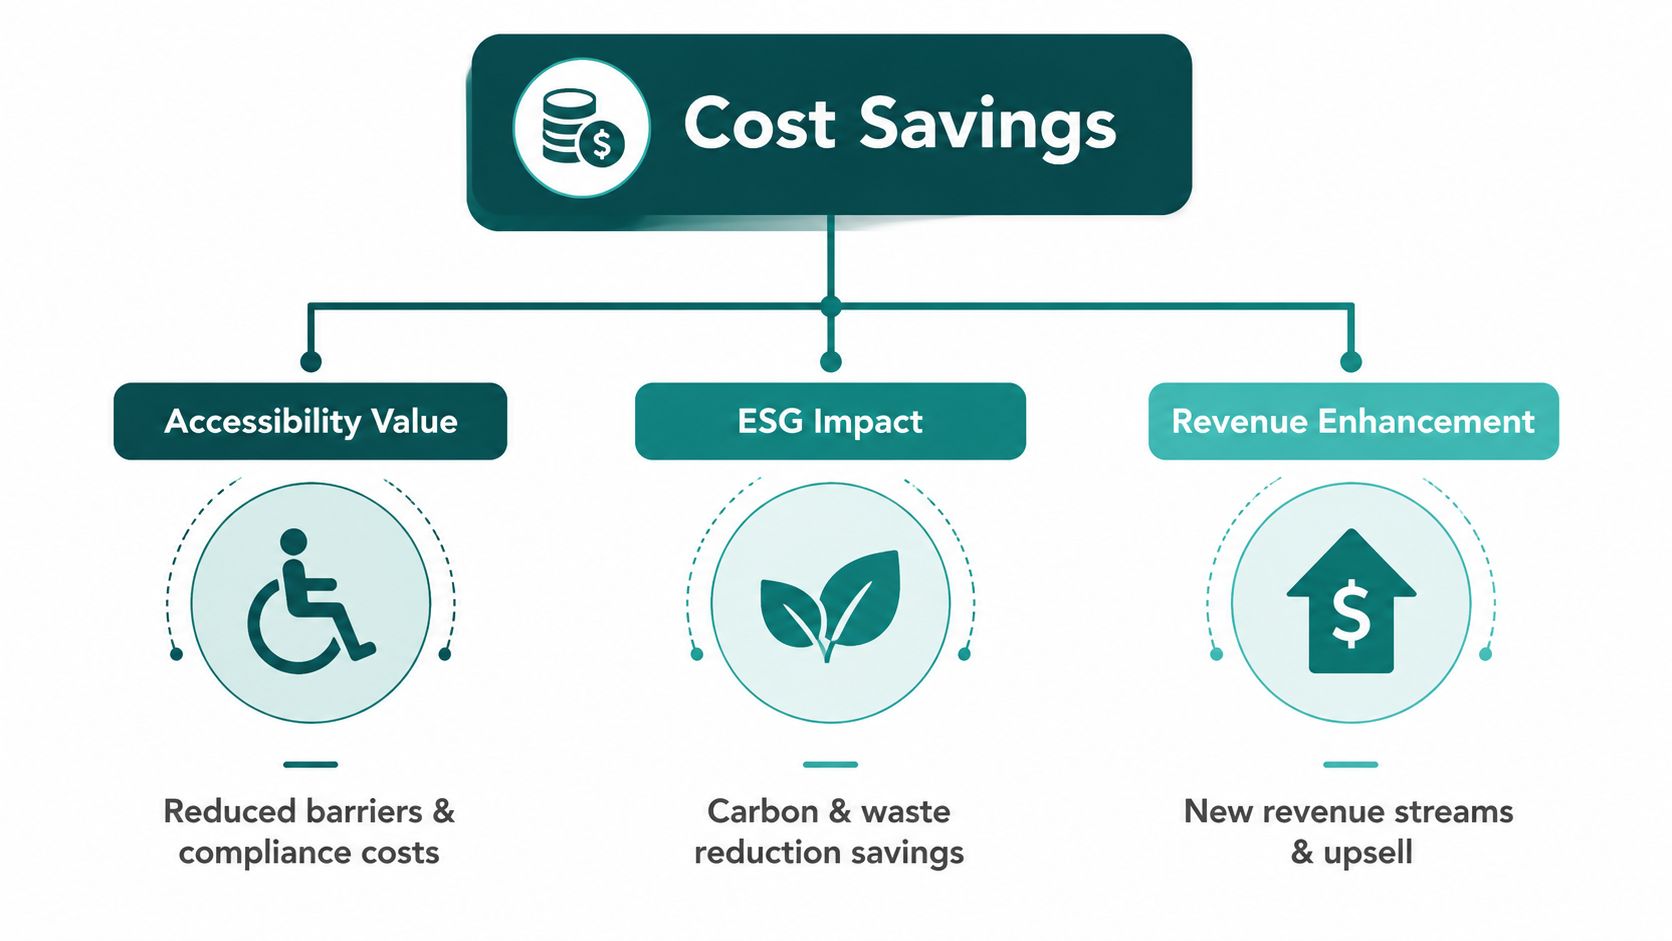
A single cash figure gives the board only part of the answer. For venues and transit operators, a stronger cost-savings measurement framework separates four value categories and reports each against its own evidence.
Four measures that belong in the same portfolio
Cash-releasing savings reduce an approved budget or actual cash outflow. Examples include a lower supplier price, cancelled maintenance work or a reduction in paid assistance hours that has been removed from the budget.
Avoided expenditure records a cost that the organisation no longer needs to incur. A venue may avoid beacon installation, wiring, battery replacement, physical signage changes or a planned expansion of staffed information points. Label this as avoided spend unless the budget has been released.
Service-quality gains capture value that accounting systems often miss. More reliable routes, fewer missed connections, easier access to facilities and reduced staff intervention can support inclusion and operational resilience without creating a matching budget reduction. UK government guidance explicitly separates cash-releasing and non-cash-releasing savings and recognises that quality improvements or avoided expenditure may not be cashable.
Revenue impact should be tied to observed commercial outcomes rather than assumed uplift. For a shopping centre, that may involve visitor experience, repeat visits or time spent in accessible areas. Waymap's discussion of footfall in retail provides relevant context for connecting wayfinding with the commercial experience without treating every positive response as revenue.
Accessibility also has an economic dimension. OECD analysis of the UK Access for All rail programme found that step-free access benefits exceeded costs by 2.4:1 at one station and remained positive at a benefit-cost ratio of 1.08. The same analysis modelled the cost of making the entire Great Britain rail network step-free at approximately £2.3 billion to £5.6 billion, with a central estimate of £4.3 billion, representing roughly 1% to 3% of total transport capital investment over the following decade. These figures don't provide a ready-made business case for every venue, but they show why accessibility can be assessed as an investment rather than a compliance-only expense.
Keep obligation and value connected
The Equality Act 2010, ADA Title III, BS 8300, PAS 78 and BS EN 17210 all shape how organisations think about accessible environments. The precise obligation depends on jurisdiction and context, but the commercial implication is consistent: accessibility investment may protect service continuity, reduce avoidable friction and support a defensible compliance position.
For energy and estate-related comparisons, a resource on lower operating costs for businesses can help teams identify wider operating-cost categories alongside navigation and accessibility measures. The board should see the categories separately, then review the combined portfolio without implying that every benefit is cash.
Collecting and Validating Your Data Sources
Savings calculations fail most often because the source records don't support the precision of the conclusion. A robust data pack combines procurement evidence, operational records and accessibility or user-experience evidence, with each source dated and assigned to an accountable owner.
Three evidence groups
Procurement and spend data includes contracts, invoices, purchase orders, approved budgets, tender submissions and supplier pricing. Reconcile invoice values to ledger entries and confirm that the compared services have equivalent scope. A lower price for a reduced service isn't a saving unless the difference is understood.
Operational performance data includes maintenance tickets, signage replacement schedules, staff-assistance logs, help-desk contacts, route incidents and service volumes. Transit operators should distinguish a change in demand from a change in performance. Venues should record whether fewer enquiries reflect better navigation or just lower attendance.
Accessibility and user-experience data can include structured feedback, assisted-navigation records, complaints, destination completion records and observations from accessibility teams. Use respectful, consent-based collection and avoid treating a small number of comments as a quantified population result.
Scale sampled evidence carefully
UK government digitisation guidance describes a practical approach for estimating the difference between online and offline transaction costs. Teams sample service data, assign a cost per transaction from the sampled distribution, calculate the online and offline cost delta, then scale the result across volumes using a Monte Carlo-style simulation. This approach can support a wayfinding comparison, such as assisted navigation versus digital self-service, but only if the sample, assumptions and volume distribution are documented.
The same material uses an assumption set of 100% automation for routine tasks, 10% for non-routine tasks and a 15% minimum productivity-savings lower bound. Those assumptions show how quickly a model can become over-optimistic when teams classify too many tasks as routine.
When records are incomplete, don't fill the gaps with invented certainty. Use a shorter observation period, label estimates, obtain supplier confirmation or select a conservative proxy. A documented master waste stream analysis illustrates the same principle in another operational context, where reliable categorisation must precede a credible reduction claim.
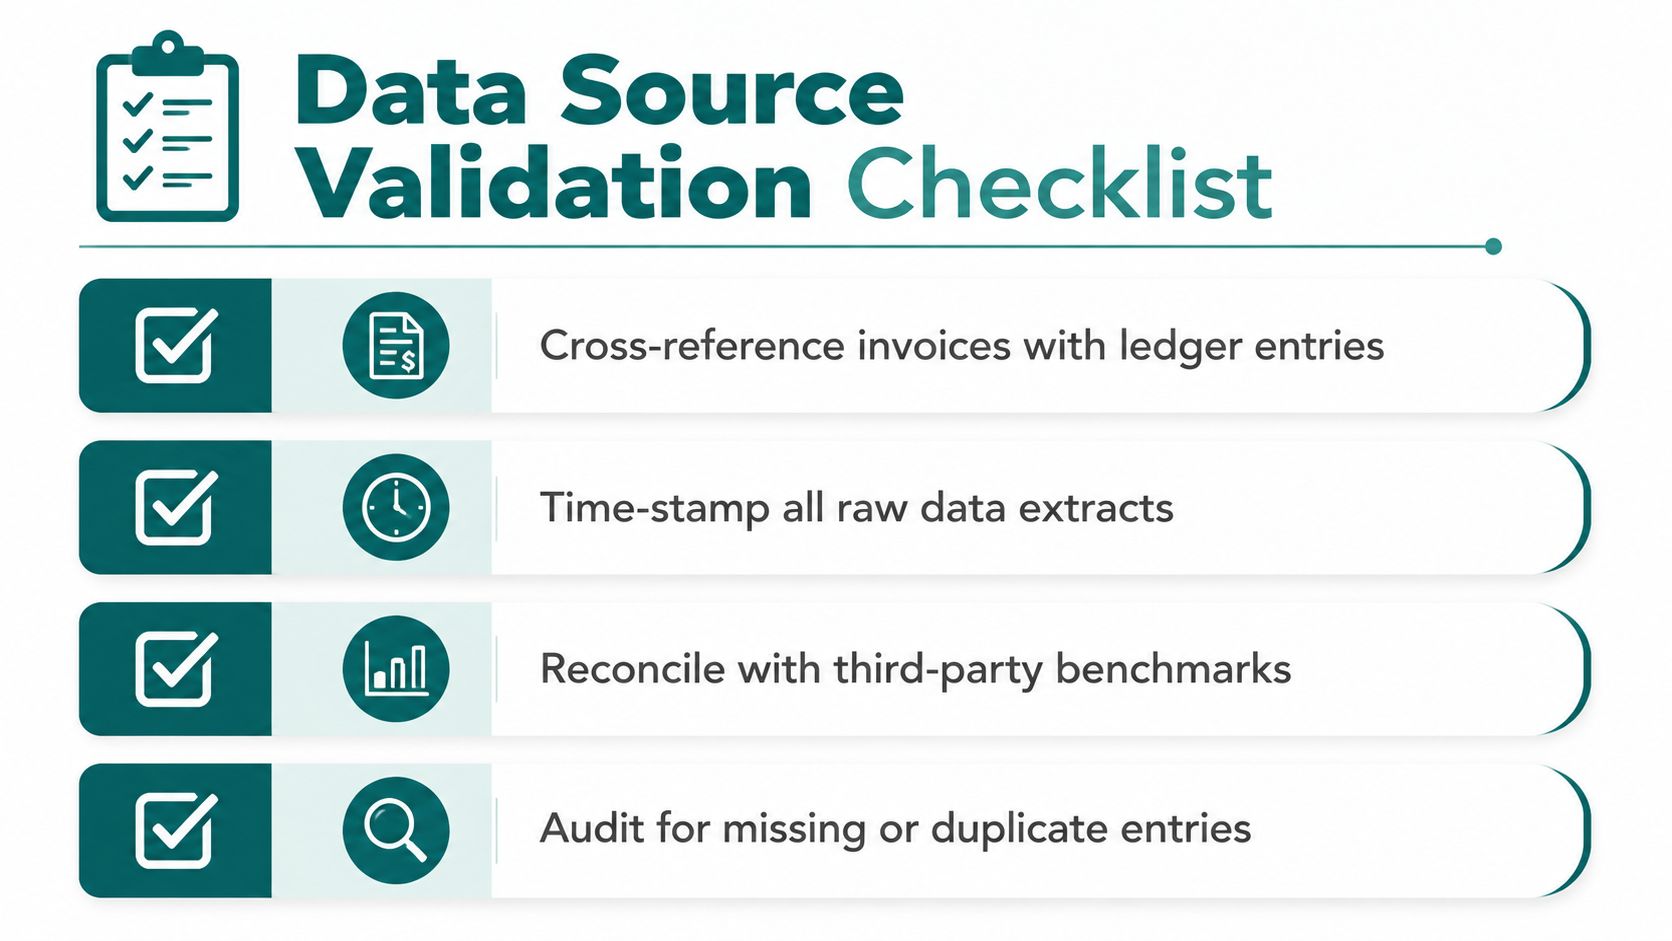
Use this validation checklist:
- Reconcile records: Match invoices, ledger entries and contract schedules.
- Timestamp extracts: Preserve the date and version of every raw data file.
- Triangulate results: Compare internal records with supplier or sector benchmarks.
- Test completeness: Search for missing, duplicated or reclassified entries.
Waymap's data migration process is relevant when historic maps, points of interest or route records need to be moved into a new operational system. The same audit discipline applies to financial data.
Calculating Gross and Net Savings With Real Formulas
The calculation should show what changed, how much activity was affected and what the organisation had to spend to achieve the result. UK procurement guidance uses this formula:
Baseline Price (BP) × Forecast Volume (FV) − New Price (NP) × Forecast Volume = Saving
For a hypothetical transit operator replacing a beacon-based navigation contract with infrastructure-free navigation, define BP as the delivered price of the old service, NP as the delivered price of the new service and FV as the forecast volume covered by both. Don't insert a guessed volume to enlarge the result. Use the approved forecast, explain its source and revise the claim if actual activity differs.
Use the right method when volume is uncertain
Where forecast volume is unknown, UK guidance gives an annualised method:
(BP − NP) / BP × 100 = percentage saving
That percentage is then applied to annual total spend. The result remains a percentage-based estimate until the organisation confirms the relevant annual spend and scope.
For one-off projects with no baseline, the documented formula is:
Estimated Budget − Actual Tender Price = Actual Cashable Saving
That method is appropriate only when the estimated budget was approved and represented the work that was delivered. An inflated or outdated estimate isn't a credible baseline.
A separate government technical note treats spend-control savings as the difference between forecast cost in the original business case and the approved business case. Those savings are claimed annually according to the forecast spend profile over the life of the project. This is different from comparing actual spend with last year's spend, and the distinction should be visible in the report.
Gross is not the board number
Gross savings are the unadjusted difference between the counterfactual and the new cost. Net savings deduct implementation, migration, mapping, training, support, ongoing maintenance and any displacement effects. If a venue reduces physical signage work but adds a new service-management role, the additional role belongs in the net calculation.
The NAO reporting principles require savings to be net of costs, realised, sustainable, new to the period, not reallocated, cash releasing where claimed as cash, quality-neutral in high-priority areas and scored only once. A maintenance review can also help identify whether planned inspections or asset failures affect the counterfactual. Teams considering how to deploy predictive maintenance from Forge Reliability should apply the same separation between projected avoidance and realised reduction.
For navigation projects, Waymap's maintenance cost reduction information can sit alongside the operator's own records. The claim still needs local evidence, including the infrastructure that would otherwise have been installed or maintained.
Attributing Savings and Avoiding Double-Counting
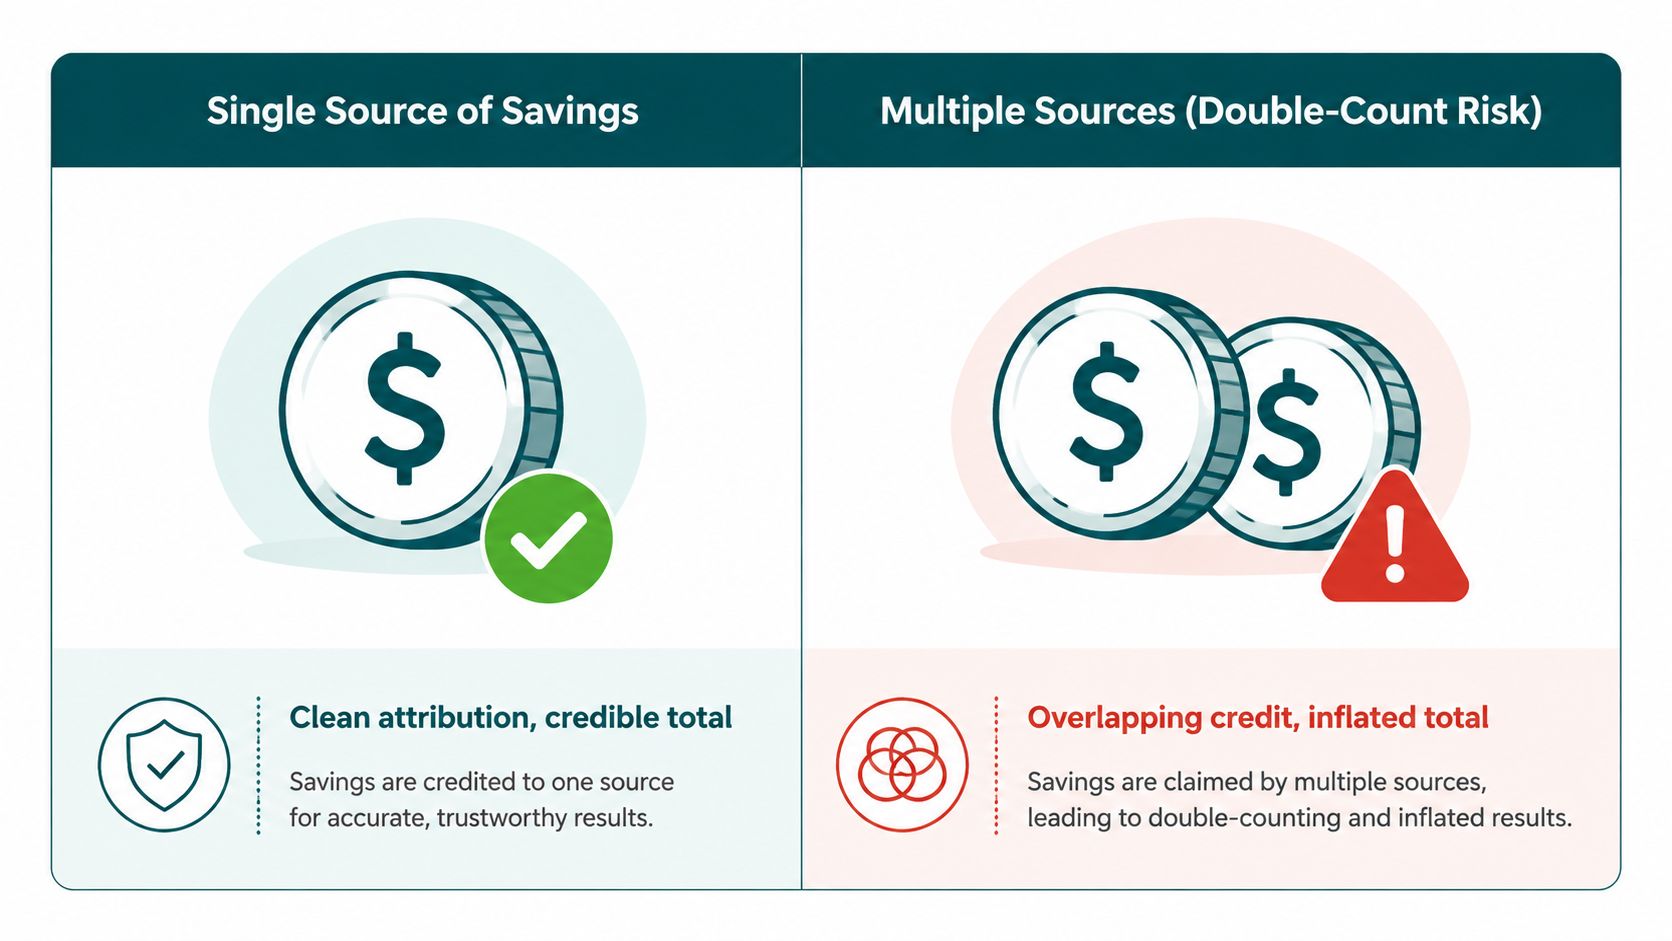
Double-counting happens when one operational change appears in several sections of the benefits report. Suppose fewer assistance requests reduce staff pressure. Counting that once as an operational saving and again as an accessibility benefit inflates the total unless the categories describe different, evidenced outcomes.
The NAO principle is straightforward: savings must be scored only once. That doesn't mean an intervention can have only one benefit. It means each benefit needs a unique financial or performance owner.
Build an attribution matrix
| Saving stream | Primary evidence | Unique attribution |
|---|---|---|
| Physical signage | Maintenance invoices and replacement records | Facilities or asset-maintenance budget |
| Navigation assistance | Staff logs and rota records | Assistance-service capacity, only if released |
| Accessibility quality | User feedback and completion evidence | Non-cash service-quality benefit |
| Compliance risk | Legal, governance and assurance records | Avoided exposure, not realised cash unless evidenced |
| Commercial experience | Commercial reporting and visitor measures | Revenue impact, only when linked to observed income |
A deployment at WMATA, the Royal Hospital for Children and Young People or Lord's Cricket Ground should therefore be assessed against the specific problem it addresses, not assigned a universal saving label. If digital directions reduce the need for temporary signs during changing layouts, attribute the result to facilities. If users reach a platform or destination with less assistance, record that under service quality or assistance capacity, then avoid claiming the same labour value twice.
The compliance case also needs restraint. The Equality Act 2010 creates relevant duties in the UK, while ADA Title III applies in the United States. A navigation service can support an organisation's accessibility response, but don't label avoided litigation or enforcement cost as a realised saving without a documented, approved counterfactual.
A benefit can be strategically important without being cashable. That makes it reportable, not automatically monetisable.
Check whether the baseline was already inflated, whether the saving was included in the approved business case and whether a budget move has been mistaken for a reduction. Waymap's third-party verification approach is relevant to the broader principle. Independent review is most useful when the reviewer receives the baseline, assumptions, source records and attribution rules, not only the final total.
Running Sensitivity Analysis and Presenting Results
A point estimate hides the assumptions that matter most. Venue and transit models commonly depend on forecast volumes, task classification, maintenance frequency, adoption, staffing arrangements and the cost of the alternative that would have been funded. Sensitivity analysis makes those dependencies visible before a board member exposes them.
Stress-test the assumptions
Start with the approved base estimate. Then vary one assumption at a time, followed by a combined scenario. The model should show at least:
- Volume sensitivity: Test what happens if activity is lower or higher than forecast.
- Automation sensitivity: Separate routine tasks from non-routine tasks and apply documented assumptions.
- Maintenance sensitivity: Include both expected support costs and the risk of recurring physical infrastructure work.
- Adoption sensitivity: Distinguish available capability from actual use.
- Counterfactual sensitivity: Compare the selected alternative with a credible lower-cost and higher-cost option where both were plausible.
The UK digitisation material is a useful warning because its assumption set includes 100% automation for routine tasks, 10% for non-routine tasks and a 15% minimum productivity-savings lower bound. The lesson isn't to transfer those assumptions automatically to wayfinding. It is to show how sensitive the result becomes when teams change the boundary between routine and non-routine work.
For Waymap, the technical comparison should be explicit. The platform uses dead reckoning from device-native sensors, works without GPS, Wi-Fi or installed beacons, is designed for sub-3-metre accuracy in infrastructure-free environments and doesn't require pre-mapping. Those characteristics can remove capital and maintenance lines from the counterfactual, but the report should still include mapping, content management, support and implementation costs. The relevant comparison may be against beacons, signage or staffed assistance, depending on the approved alternative.
Present the result as an audit trail
A useful board dashboard has four panels:
- Methodology summary: State the baseline, counterfactual, period, scope and definition of each saving category.
- Gross-to-net bridge: Show the starting difference, implementation costs, recurring costs and displacement effects.
- Sensitivity range: Present base, conservative and favourable outcomes, with the changed assumptions beside each result.
- Attribution register: Tie every benefit to one cost centre, operational owner and source record.
Add a short data appendix. It should identify the extract date, responsible owner, contract version, forecast source, calculation formula and unresolved limitations. If an estimate is non-cash-releasing, label it clearly rather than placing it beside cash savings without qualification.
Use a one-page review checklist
Before approval, ask:
- Baseline: What would have happened without the intervention?
- Metrics: Is the result cash releasing, avoided expenditure, service quality or revenue impact?
- Data: Can another person reconcile every input to a source record?
- Net value: Have implementation and ongoing costs been deducted?
- Attribution: Has each benefit been scored once?
- Realisation: Has the organisation achieved the result, or is it still forecast?
- Sustainability: Will the saving continue without a temporary restriction or deferred work?
- Compliance: Does the case support relevant obligations under the Equality Act 2010, ADA Title III, BS 8300, PAS 78 or BS EN 17210?
The framework is simple to remember. Define the baseline, including the counterfactual. Choose the metrics, separating cash from wider value. Collect and validate data, preserving an audit trail. Calculate gross and net savings, with all delivery costs included. Attribute without double-counting, then test the result against changed assumptions.
Avoid four recurring errors: relying on year-on-year spend differences, counting one benefit in multiple categories, ignoring implementation and maintenance costs, and presenting a sensitivity range as though it were a single realised amount. HM Treasury's Government Efficiency Framework and the NAO principles provide the most relevant UK reference points because they require savings to be reliable, verifiable, net of costs, sustainable and scored only once.
The strongest accessibility business cases don't pretend that every benefit becomes a budget reduction. They show precisely which costs disappear, which costs are avoided, which service outcomes improve and which commercial effects remain subject to evidence. Infrastructure-free navigation produces a different savings profile from beacon-based or signage-based alternatives because the counterfactual can include capital, wiring and ongoing hardware maintenance. The board can then decide on the full value rather than an overstated cash figure.
Use the checklist with your finance, estates, procurement and accessibility leads before the next business-case review. Waymap provides indoor, outdoor and underground navigation to exact doors, platforms and points of interest without GPS, Wi-Fi or installed hardware, so visit Waymap to assess the infrastructure-free alternative against your own baseline, counterfactual and maintenance records.
