
Footfall in Retail: The Ultimate Guide for 2026

A visitor walks into your shopping centre with clear intent. They want one shop, one service, maybe a coffee on the way out. If they cannot find what they need, your footfall number still goes up. Your commercial performance does not.
That gap is why footfall in retail deserves a more serious treatment than a simple door count. The operators who get value from footfall data do not stop at “how many people came in”. They ask better questions. Where did people hesitate? Which routes felt confusing? Which zones looked busy but did not convert? Which visitors were effectively excluded by layout, signage, or poor wayfinding?
From a mobility and wayfinding perspective, footfall is a measure of movement quality. It tells you how well a venue helps people achieve their purpose. That includes parents with prams, older visitors, tourists, and disabled shoppers who may face barriers that standard analytics often ignore.
Retail teams usually focus on sales, leasing, staffing, and campaign results. They should. But the venues that outperform over time tend to manage footfall as an operational system. Layout, wayfinding, accessibility, and visitor confidence all shape what happens after someone crosses the threshold.
Beyond the Door Counter Why Footfall in Retail Matters
A family arrives on a Saturday afternoon. They need baby changing facilities before they shop. The directory is hard to spot, the route is unclear, and they lose time circling the same corridor. Nearby, a shopper with low vision is trying to find a specific retailer in a large multi-level centre. They entered the building, so they count as footfall. But their experience is full of friction.

This is the mistake many retail teams make. They treat footfall as proof of demand, when it is often only proof of arrival. A headcount cannot show whether visitors found what they needed, abandoned a purchase, avoided a wing of the centre, or left with a poor impression.
Quantity matters but quality pays
A busy venue can still underperform. You may have strong traffic at the entrances and weak movement deeper inside. You may have long dwell times that look positive until you realise people are lingering because they are lost, stuck in queues, or navigating around obstacles.
In practice, footfall matters because it connects three operational questions:
- Commercial performance. Are visitors reaching the units, categories, and promotional areas that matter most?
- Visitor experience. Can people move confidently from arrival to destination without confusion?
- Operational effectiveness. Are layout, staffing, and wayfinding helping or hindering flow?
When those three align, footfall becomes useful. When they do not, the metric can be misleading.
Why traditional reporting misses the complete story
Many dashboards still emphasise total entries, peak periods, and broad traffic trends. Those figures are useful for staffing and benchmarking, but they do not explain behaviour inside the venue.
A better reading of footfall in retail looks at intent fulfilled. Did the person who came for a pharmacy, a click-and-collect order, or an accessible toilet get there quickly? Did they explore beyond that task? Did they leave confident enough to return?
Good footfall is not just more people. It is more people successfully doing what they came to do.
This shift matters even more in large or complex environments such as malls, transport-linked retail, mixed-use sites, and multi-level centres. In those spaces, wayfinding friction can distort everything from leasing performance to customer satisfaction.
The Key Metrics That Define Retail Footfall
The most useful footfall metrics work together. On their own, they can mislead. Read together, they show whether your venue is easy to understand, easy to move through, and worth spending time in.
Start with counts then move deeper
Entry and exit counts are the starting point. They tell you how many people crossed a threshold. They are good for trend lines, staffing plans, and campaign timing. They are not enough for diagnosis.
The more revealing metrics sit behind the count.
- Dwell time shows how long people stay in the venue or in specific zones.
- Conversion rate links visits to purchases or another desired action.
- Visitor paths show where people go, not where the floor plan assumes they will go.
- Bounce rate captures short, unsuccessful visits.
- Zone engagement shows which areas attract sustained attention and which fail to hold it.
Think of a venue like an airport terminal. Passenger numbers matter, but operators also need to know where queues build, where people miss signs, and where circulation breaks down. Retail is no different.
What each metric tells you
A few practical readings matter more than the definition itself.
| Metric | What it helps you understand | Common mistake |
|---|---|---|
| Entry count | Demand at the door | Treating arrival as success |
| Dwell time | Level of engagement or friction | Assuming longer is always better |
| Conversion rate | Commercial effectiveness | Looking at sales without visit context |
| Visitor paths | Route choice and discoverability | Trusting design intent over observed behaviour |
| Bounce rate | Failed or low-value visits | Ignoring why people left quickly |
A high dwell time near a feature display may indicate interest. The same dwell time near a directory may indicate confusion. Context decides whether the number is good or bad.
Read metrics as a chain not a list
The strongest operators do not review these numbers in isolation. They ask cause-and-effect questions.
For example:
- Entries rise but conversions stay flat. Marketing may be driving visits, but the in-store journey is weak.
- Dwell time increases in one corridor. That could signal successful merchandising, or a wayfinding bottleneck.
- A zone gets traffic but low engagement. People may be passing through rather than shopping.
- Bounce rates rise near one entrance. The threshold experience may be poor, or the destination may be hard to find.
The most overlooked KPI is confidence
Retail teams often discuss “ease of wayfinding” in qualitative terms. It should be treated as a measurable operating condition. Confident visitors move with purpose. Uncertain visitors slow down, backtrack, cluster around signs, ask staff for help, or abandon secondary destinations.
You will not always have a neat confidence score on a dashboard. But you can infer it from path irregularity, repeated pauses, short failed visits, and uneven distribution between visible and less visible areas.
If people only visit the easiest-to-find units, your footfall pattern is telling you something about how people find their way, not just tenant appeal.
That is where footfall in retail becomes strategically useful. It stops being a vanity metric and starts acting like a diagnostic tool.
Comparing Footfall Measurement Methods
The method you choose shapes the decisions you can make later. Some tools are fine for counting entries. Others help you understand movement, dwell, and wayfinding friction inside the venue. Very few do both well without operational trade-offs.
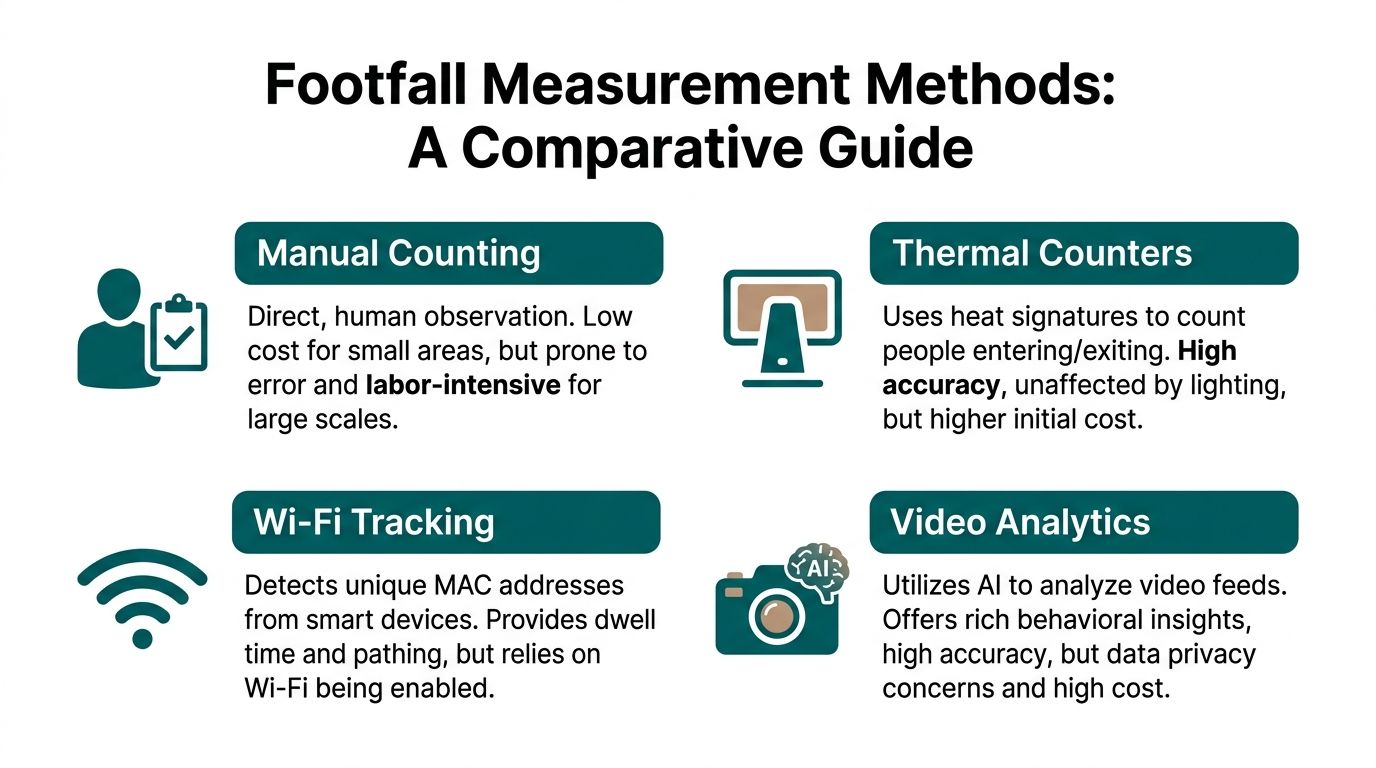
Manual counting and fixed hardware
Manual counting still appears in small stores, temporary activations, and short audits. It is simple. It is also limited. Staff can count entries, note queue length, or estimate busy periods, but manual methods do not scale well and rarely capture pathing with consistency.
Thermal counters improve on this for door-level measurement. They are useful when the priority is entry and exit accuracy in a defined location. The limitation is obvious. They tell you that someone crossed a threshold, not what happened after.
These methods can still play a role. They just should not be mistaken for a full footfall strategy.
Wi-Fi and Bluetooth approaches
Wi-Fi and beacon-based systems have been popular because they can infer presence and movement from device signals. In the right environment, they can support dwell and route analysis. But they come with practical constraints.
Signal quality varies. User settings affect detection. Hardware adds deployment and maintenance overhead. In complex indoor environments, especially where signal conditions are inconsistent, these systems can become harder to rely on for precise journey analysis.
That is one reason many venue teams now revisit the basics of indoor positioning systems. They are asking not just “can we detect a device?” but “can we understand movement well enough to improve the visitor experience?”
AI video analytics
AI video analytics has become one of the strongest options for rich in-venue insight, especially where operators already have CCTV. In UK retail environments, AI-powered video systems from existing CCTV can reveal links between layout, dwell time, and conversion. The same analysis found that optimising high-traffic hot zones, defined as areas with dwell times above two minutes per visitor, can increase sales by 15 to 20%, and a major UK shopping centre chain reported a 32% uplift in conversion rates after moving high-margin products into zones capturing 60% of total footfall density according to the Agrex AI guide to retail footfall analytics.
That is powerful because it ties movement to commercial action. It helps operators see not only where people go, but what layout changes improve outcomes.
The trade-offs are also real:
- Privacy governance needs careful handling.
- Camera placement affects coverage quality.
- Interpretation still matters. A heatmap alone does not explain why a zone underperforms.
- Cost and complexity can rise when venues need broad coverage and detailed analysis.
Sensor-fusion and smartphone motion approaches
A newer category matters for large, complex venues. Sensor-fused, smartphone motion-based systems analyse movement through the device people already carry. This approach removes dependence on installed beacons and can work in places where signal-based approaches struggle.
From a venue perspective, the appeal is practical:
- no beacon estate to maintain
- faster rollout
- updateable wayfinding layers
- better fit for accessibility use cases
- potential to connect movement insight with actual wayfinding support
This approach changes the role of footfall technology. It is no longer just observational. It can become assistive. Such a system, by helping people find their way, can also reveal where the environment itself is creating friction.
Choose for the decision you need to make
If your only question is “how many people entered?”, use a simpler method.
If your question is “why are some units easy to find and others effectively invisible?”, you need more than a door counter.
The best measurement method is the one that matches the operational decision in front of you, not the one with the longest feature list.
For most modern retail venues, that means combining commercial analytics with wayfinding understanding. Counting people is useful. Understanding whether they could move confidently through the space is where the bigger gains tend to appear.
How to Interpret Footfall Data for Inclusive Growth
The most common error in footfall analysis is to assume low traffic means low demand. Sometimes it does. Sometimes it means the route is awkward, the entrance is hidden, the signage is poor, or the space feels inaccessible.
That distinction matters if you want growth that lasts.
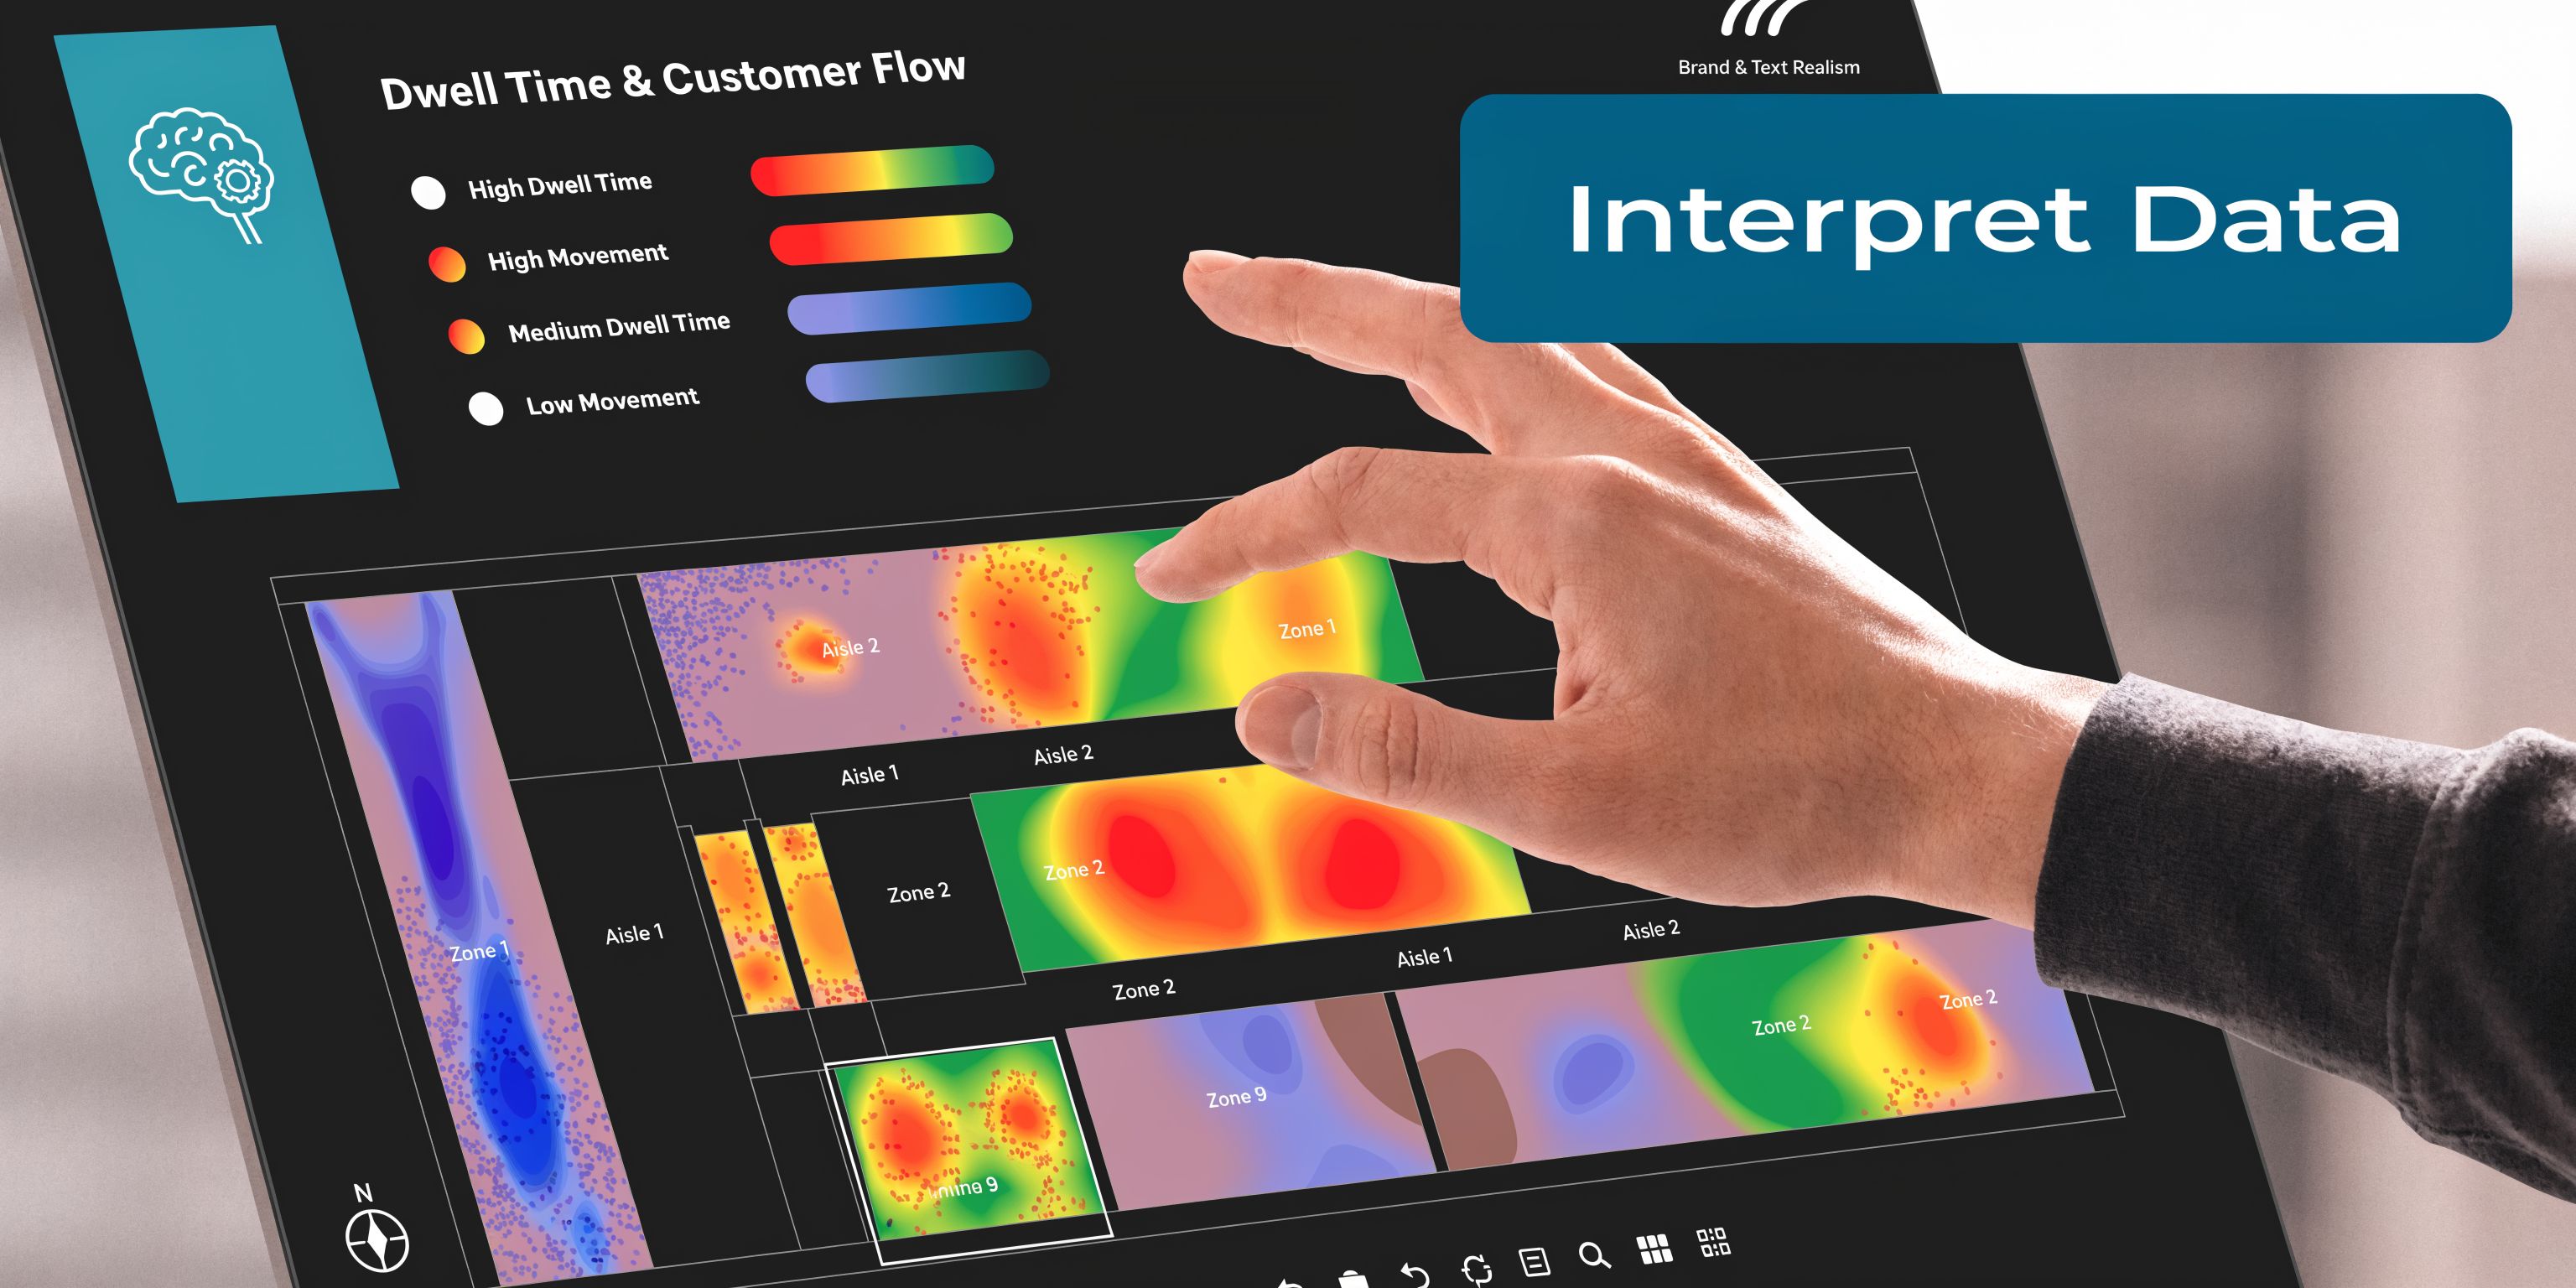
Read hot zones and cold zones carefully
Heatmaps are often presented as simple good-versus-bad visuals. Busy areas look successful. Quiet areas look weak. Complete interpretation is more demanding.
A hot zone can mean convenience, strong merchandising, or a bottleneck. A cold zone can mean weak retail appeal, but it can also point to avoidable friction.
Ask practical questions:
- Is the route obvious from the main entrance?
- Do visitors need to change level or direction in a way that feels uncertain?
- Are key services easy to locate for first-time visitors?
- Does the zone rely too heavily on visual cues?
If a quiet area becomes busier only when staff physically direct people there, the issue is not demand. It is discoverability.
Use an accessibility lens from the start
Many retail analytics programmes are still thin in this area. Limited data and strategy exist on how accessibility barriers shape uneven footfall distribution in UK retail venues. UK-specific data shows that 10 million working-age disabled people face barriers in accessing services, including retail. 16% report difficulties entering shops and 20% struggle with finding items inside, while venues adopting dynamic audio wayfinding could boost inclusive footfall by 15 to 20% according to reporting referenced by Talk Business on retail foot traffic and accessibility barriers.
Those figures should change how operators read their maps. If disabled visitors face a harder journey, then “natural” footfall patterns may reflect structural exclusion.
A useful next step is to review how digital guidance and social impact intersect in initiatives such as App for Good, where wayfinding is treated as a practical inclusion tool rather than a nice-to-have feature.
Segment by need not just by time
Many venue teams segment footfall by hour, day, and campaign period. That is useful for scheduling. It does not tell you enough about who your layout works for.
A stronger interpretation model includes:
- Purpose-led journeys such as pharmacy, dining, click-and-collect, toilets, lifts, or family facilities
- First-time versus repeat visitors
- Visitors who need step-free or low-friction routes
- Users likely to rely on non-visual guidance
This does not require invasive profiling. It requires designing your analysis around route success and environmental friction.
What inclusive growth looks like in practice
Inclusive growth is not just about attracting more visitors. It means removing the barriers that suppress visits, shorten dwell in the wrong places, or stop people from reaching lower-visibility areas.
When a venue becomes easier to find your way in for disabled visitors, it usually becomes easier to move for everyone else as well.
That is why footfall in retail should be interpreted as a service-performance signal. If certain journeys are consistently harder than they should be, the data is telling you where to act. The fix may be signage, staff deployment, route redesign, or digital wayfinding. But the first step is reading the pattern correctly.
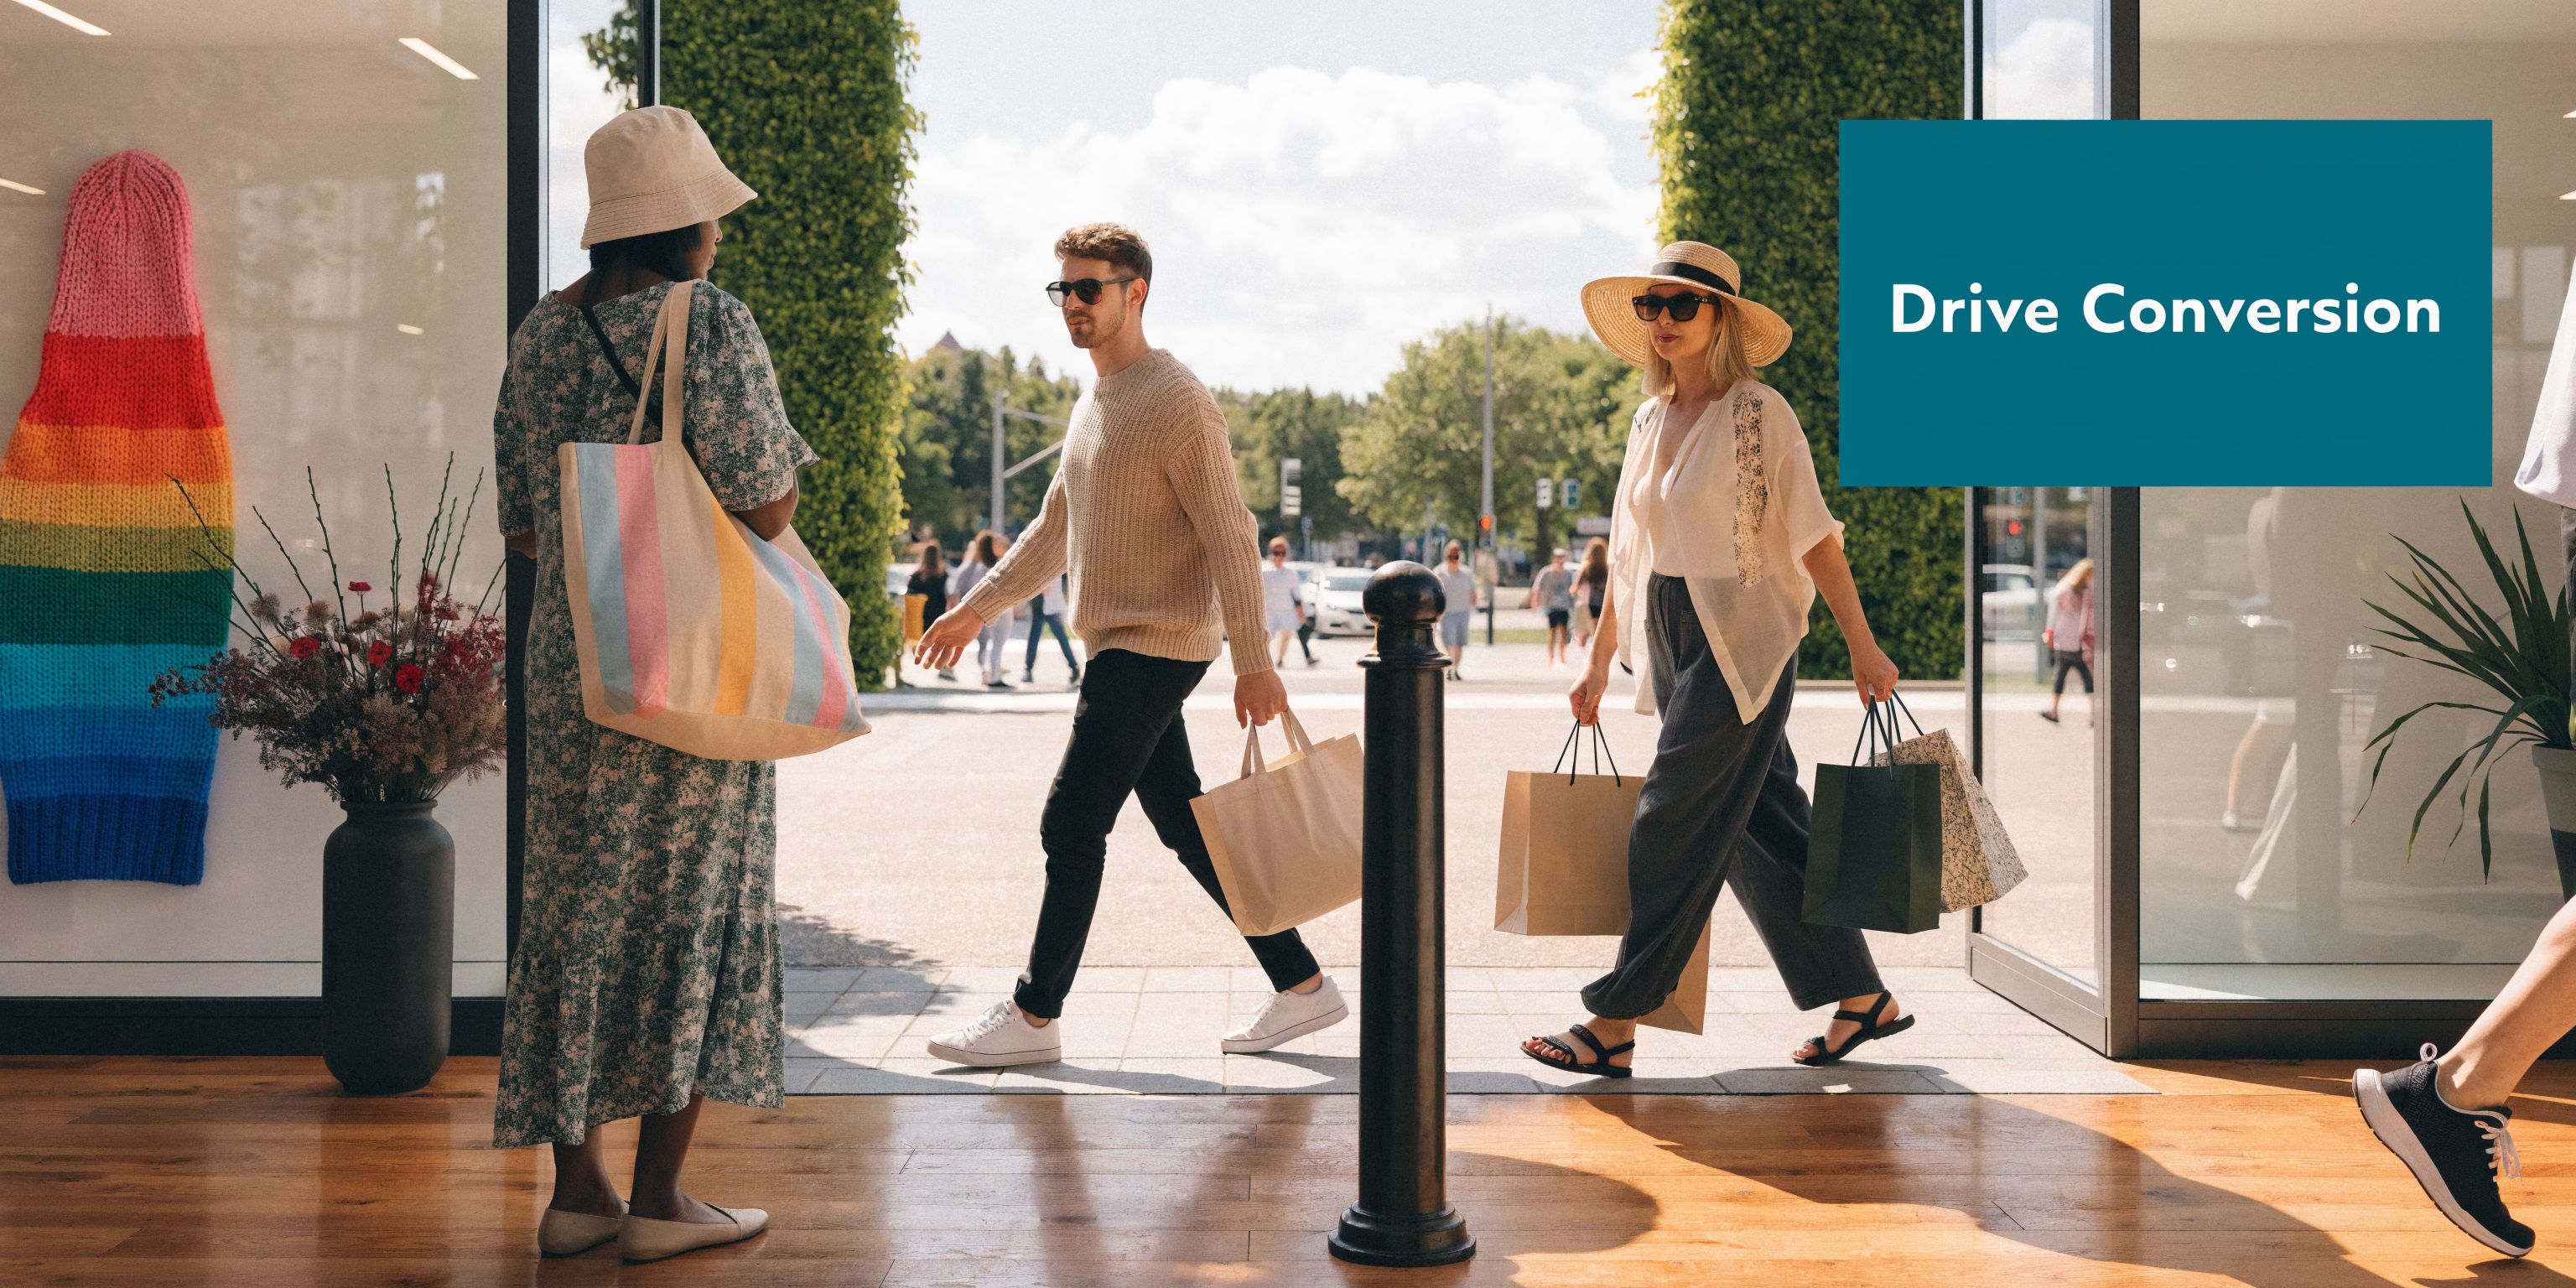
Proven Strategies to Increase and Convert Footfall
If traffic is underperforming, many operators jump straight to events, promotions, or leasing changes. Those can help. But they work far better when the visitor journey is already clear.
The strongest strategy mix combines attraction, wayfinding, and conversion.
Fix discoverability before chasing more traffic
A venue that is hard to move through leaks value. You can spend on campaigns, improve tenant mix, and refresh creative. If visitors still cannot confidently find stores, facilities, or secondary zones, part of that investment is wasted.
Start with the basics:
- Clarify arrival moments. Entrances should quickly orient visitors to major destinations.
- Reduce decision stress. Too many sign types or inconsistent naming makes movement harder.
- Support task-based visits. People looking for one essential stop should be able to complete it easily, then continue exploring.
- Make lower-visibility zones findable. Quiet areas often need better routing, not just more promotion.
Use wayfinding to unlock hidden demand
UK-specific indoor positioning analysis shows that wayfinding friction in large venues causes 25 to 30% footfall loss in low-visibility areas, and 2025 UK retail studies cited by Growth Factor on retail foot traffic data and IPS report that sensor-fused audio wayfinding increased effective footfall conversion to purchases by 18% in malls by reducing cold-zone dwell abandonment.
That finding matters because it reframes a common retail problem. Cold zones are not always merchandising failures. In many centres, they are wayfinding failures.
Detailed, updateable shopping mall floor plans are part of the answer because they turn a static map into a usable journey layer. Once visitors can route to exact destinations, low-visibility areas become commercially reachable.
Build campaigns around movement not just marketing
A practical footfall strategy should link digital intent with physical completion.
Good examples include:
Promotion to destination
If a campaign advertises a limited-time offer, the route to that offer should be frictionless once the visitor arrives.Service-led visits
Centres often attract visitors for one purpose, such as a return, a repair, or a meal. Clear wayfinding helps turn that single-purpose trip into broader exploration.Event spillover
Events can create bursts of traffic. Without route support, visitors cluster in familiar areas and miss the rest of the venue.
A short demonstration of how digital guidance can support destination confidence is below.
What works and what usually disappoints
Some interventions reliably outperform others.
| Usually works | Often disappoints |
|---|---|
| Clear routing to exact destinations | More generic signage without route logic |
| Updating digital points of interest quickly | Waiting for physical signage cycles |
| Linking promotions to easy in-venue journeys | Driving traffic to hard-to-find units |
| Designing for first-time visitors | Assuming repeat visitors represent everyone |
The most effective footfall strategy is not “bring in more people at any cost”. It is “help the right people reach the right places with less friction”.
That is especially important for accessible retail. If disabled visitors or first-time visitors can move with confidence, you improve both fairness and commercial reach. In practice, the venues that convert best are often the ones that ask the least from the visitor in cognitive effort.
Calculating the ROI of an Accessible Visitor Experience
Retail teams do not need another abstract case for inclusivity. They need a working ROI model. The good news is that accessible visitor experience can be measured in commercial, operational, and ESG terms.
Start with the baseline that matters
Footfall recovery has not been even across formats. In the UK, high streets were up 3.2% year on year in January 2025 while shopping centres were down 1.5% in Q1 2025. At the same time, only 22% of retail venues track footfall from disabled visitors, leaving a missed £12bn annual spend potential. The same source notes that 77% of retailers view footfall as a sales indicator, while motion-sensor wayfinding delivered 14% higher conversion in pilots, and ESG upgrades were associated with an 11% footfall lift in 2025 British Retail Consortium data, as cited in this Cuebiq retail footfall report PDF.
Those numbers support a straightforward point. If you do not measure the experience of disabled visitors, you are probably underestimating both lost demand and the value of fixing it.
Build ROI across three layers
A useful ROI framework has three parts.
Direct commercial return
This includes better conversion, stronger reach into lower-visibility zones, and more completed journeys to specific destinations. If visitors can find stores, services, and facilities more easily, the venue captures more of the intent it already attracted.
Operational return
Accessible digital wayfinding can reduce the burden on staff who currently answer repeat directional questions. It can also reduce dependence on static wayfinding updates, which are slower to amend when layouts, tenants, or temporary closures change.
ESG and compliance return
The return here is not just reputational. When accessibility is treated as part of venue performance, operators strengthen the evidence behind inclusion commitments and improve readiness for governance scrutiny.
What to include in your business case
Do not rely on one headline number. Use a before-and-after model with a clear scope.
- Conversion change in previously weak zones
- Visitor completion of key journeys
- Staff time spent on directional support
- Changes to repeat visitation or satisfaction signals
- Evidence of broader accessibility performance
Many venue business cases become stronger than expected in this area. A wayfinding investment may start as an accessibility initiative, then prove its value through commercial uplift, better data quality, and lower maintenance overhead.
Accessibility performs best as an operating principle, not a compliance afterthought.
That is the complete ROI case for footfall in retail. You are not only measuring more visitors. You are building a venue that more people can use successfully.
Frequently Asked Questions About Modern Footfall Tech
What is the difference between footfall counting and footfall analytics
Counting tells you how many people crossed a point. Analytics asks what happened next. It looks at movement, dwell, route choice, bounce behaviour, and how those patterns relate to layout or conversion.
Is higher dwell time always a good sign
No. Longer dwell can indicate strong engagement, but it can also signal confusion, congestion, or poor wayfinding. The surrounding context matters.
Do I need cameras to understand footfall in retail
Not always. Cameras can be valuable for rich behavioural analysis, especially when linked to existing CCTV. But they are not the only option. Some venues use threshold counters for volume and other forms of movement analysis for journey quality and wayfinding performance.
Are Wi-Fi and Bluetooth systems enough for large venues
They can be useful in some settings, especially where broad presence data is acceptable. They are less convincing when you need precise, dependable routing insight in signal-poor or complex indoor spaces.
Why does accessibility matter to footfall strategy
Because a venue that is hard to move through suppresses demand. Some visitors leave early, avoid secondary destinations, or do not return. Accessibility also improves the quality of footfall data by revealing where layout and wayfinding create hidden barriers.
What should operators measure first
Start with a practical baseline:
- Entry counts for overall demand
- Dwell by zone to identify engagement or friction
- Bounce behaviour near entrances and key facilities
- Journey success for destinations people actively seek
- Conversion by area where commercial data is available
That set gives you enough to spot patterns without overcomplicating the first phase.
How often should footfall data be reviewed
Daily monitoring helps operations teams respond quickly. Strategic interpretation usually works better on a regular cycle, where teams compare traffic patterns against changes in layout, staffing, promotions, and wayfinding.
What is the biggest mistake venues make
Treating all footfall as equal. High traffic in the wrong places, or traffic that does not translate into successful visits, is not a win. The aim is effective movement, not just volume.
Can modern footfall tech support both commercial goals and inclusion goals
Yes. In fact, the strongest systems increasingly do both. When a venue understands movement in detail and helps people find their way more confidently, it improves customer experience, uncovers hidden barriers, and creates a stronger basis for commercial decisions.
If you want to turn footfall data into better wayfinding, stronger accessibility, and more measurable venue performance, explore Waymap. Waymap helps operators guide people accurately through complex indoor, outdoor, and underground spaces without relying on GPS, Wi-Fi, or installed hardware, making it easier to improve both visitor experience and the quality of the insights behind it.