
How to Set Customer Satisfaction Objectives That Work
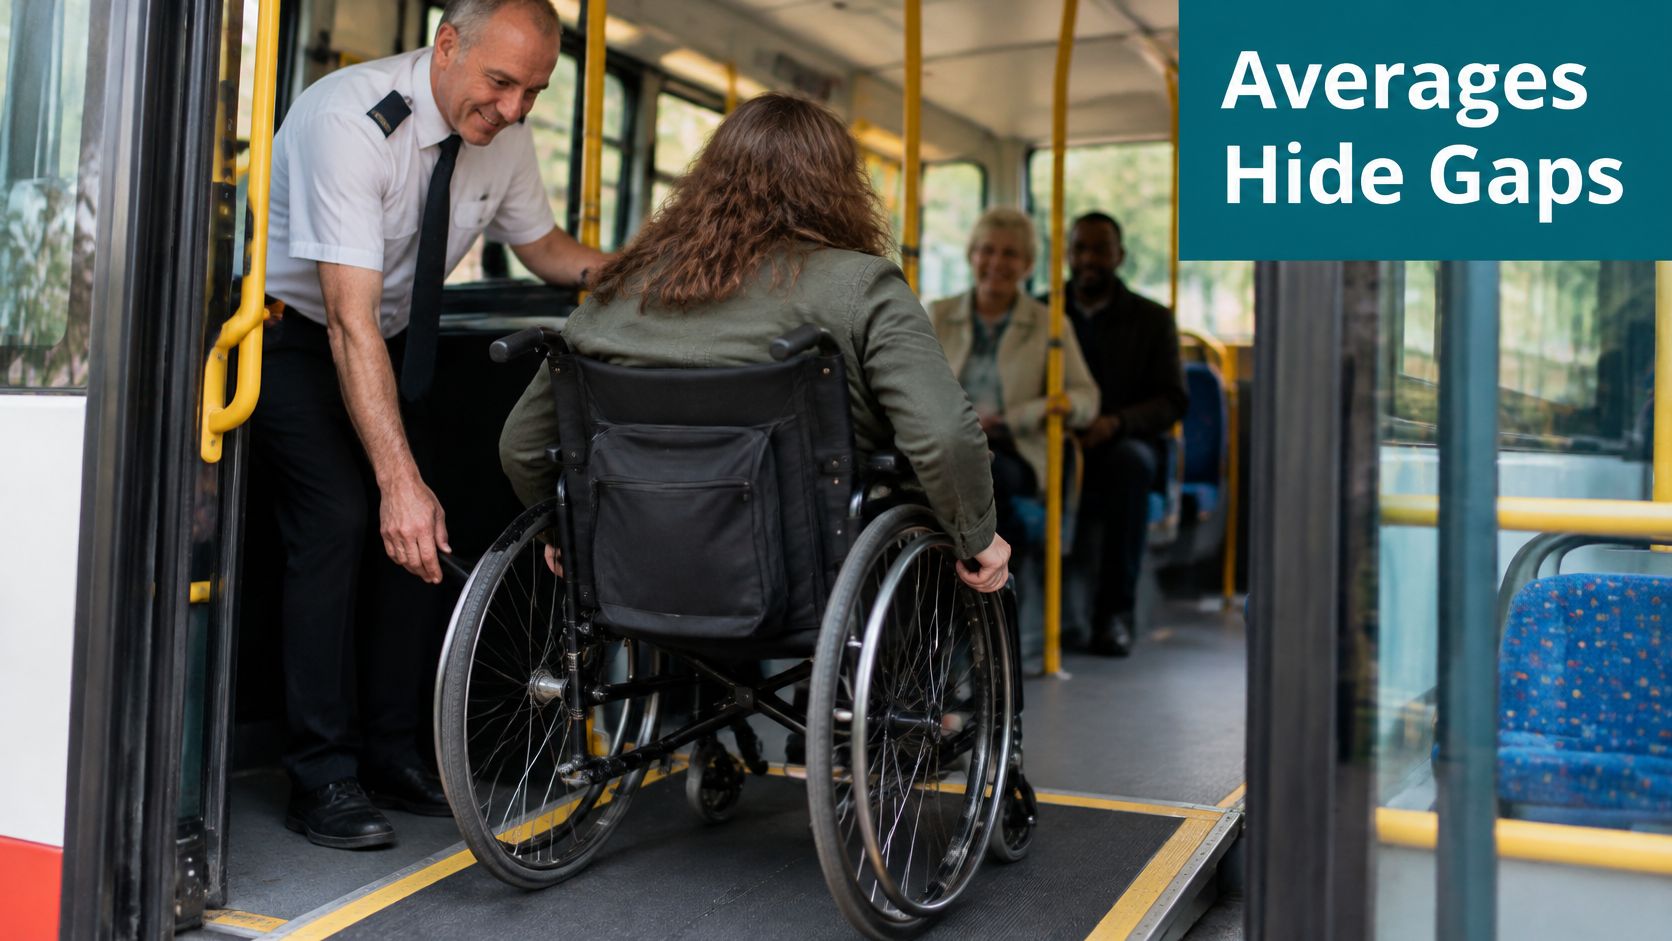
Disabled bus passengers in England were satisfied with 83% of journeys in 2025, against 87% for non-disabled passengers, a four-percentage-point gap that no single headline score would ever surface (Your Bus Journey summary report, Transport Focus). Most organisations measure the average and call the job done. The average is the least useful number in the report.
A customer satisfaction objective fixes that, because it forces a named experience, a defined group, a dated baseline and a review point into the same sentence. A score tells you how people felt. An objective tells you what you're changing, for whom, by when, and how you'll know it worked. That difference decides whether your next budget conversation runs on evidence or on optimism.
What a Customer Satisfaction Objective Actually Measures
A customer satisfaction objective turns a broad ambition into a target that can be checked. It names the experience to improve, the users covered, a dated baseline, a numeric target and the date for judging progress. Leave out any one of these, and the result is an aim rather than a measurable objective.
“Improve the customer experience” gives a team no defined result to own. “Raise satisfaction to 90%” sounds precise, but leaves open which experience is being measured, how the score is collected, whose responses count and when to assess it.
A headline score can conceal where people struggle. For navigation, pair satisfaction with a task measure, such as the share of visitors who reach the correct platform unaided. Then check both measures across user groups. An average can improve while a group that needs accessible directions still has difficulty completing the journey.
Three practical tests make an objective useful:
- It names one touchpoint. “Improve station navigation” could prompt changes to signage, staff scripts or app content. “Increase the share of visitors reaching the correct platform unaided” identifies a specific outcome.
- It sets a baseline for comparison. Record when the starting measure was taken, so the later result can be compared against it.
- It fixes a review date. A deadline gives the team a point to assess progress and decide whether the change worked.
For Waymap, the process starts with understanding the client's needs and challenges, then designing and executing a customized solution, and measuring results and feedback. Waymap was founded by Dr. Tom Pey.
UK Benchmarks to Set Your Baseline Against
UK bus satisfaction figures show why a single headline score can obscure the experience behind it.
| Measure | Benchmark | Period |
|---|---|---|
| Overall bus journey satisfaction, England outside London | 80% | 2023 |
| Journey time satisfaction, England outside London | 81% | 2023 |
| Punctuality satisfaction, England outside London | 70% | 2023 |
| Ticket value for money, fare-paying passengers, England outside London | 67% | 2023 |
| Overall bus journey satisfaction, London | 77% | Year ending March 2024 |
| Overall bus journey satisfaction, London | 85% | Year ending March 2020 |
The annual bus statistics published on GOV.UK report these figures for England outside London in 2023 and London in the years ending March 2020 and March 2024. In England outside London, overall journey satisfaction was 80%, while punctuality satisfaction was 70%. That 10-point gap gives operators a more specific issue to investigate than the headline score alone.
The lowest score in this set is 67% for ticket value for money. That measure may be less directly within an operations team's control than punctuality, because it reflects fares as well as service. Set objectives around measures your team can influence, and track other factors as context.
London's overall bus journey satisfaction was 77% in the year ending March 2024, compared with 85% in the year ending March 2020. The comparison shows why a benchmark needs a period attached: results from different years may describe different service conditions.
Benchmark rule: an objective without a baseline year is a wish with a number attached to it.
Use the table to identify a relevant comparison, then record your own measure, group and survey date. For a venue or membership programme, apply the same care to the measures connected with renewals, including the renewal insights from GolfRep.
The UK Customer Satisfaction Index, published by the Institute of Customer Service, recorded 76.1 out of 100 in January 2025. Treat a cross-sector index as context rather than a target. It cannot show whether a visitor found a particular platform or store. Waymap's visitor experience measurement can include task completion alongside satisfaction, helping venues assess the experience beyond a headline score.
How to Write a Measurable Objective in Six Steps
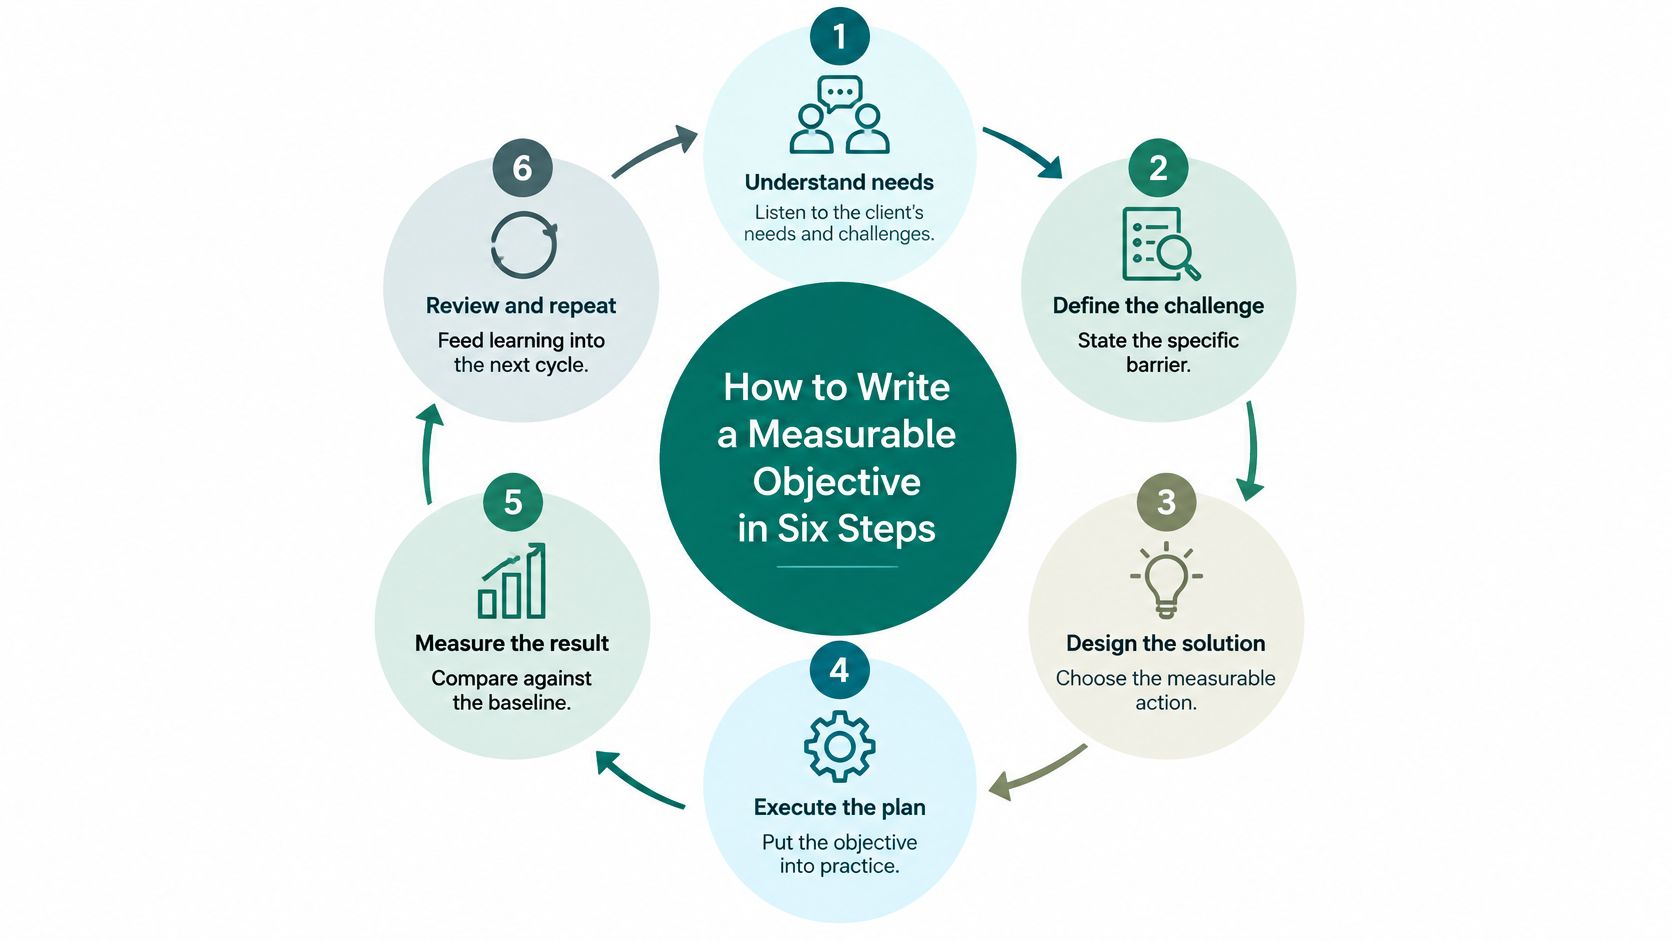
Our own process at Waymap runs in the same shape: understand the client's needs and challenges, design a customised solution, execute it, then measure results and feedback. An internal objective follows the identical loop, which is why the six steps below are worth repeating rather than treating as a one-off exercise.
The Six Steps and the Slip That Ruins Each One
- Name the experience. Be concrete: a visitor reaching the correct platform without asking a member of staff. The slip is naming a department instead of a moment, which produces objectives nobody can observe.
- Define the group. Report disabled and non-disabled users separately, and split by journey type where you can. The slip is a single population figure that averages away the users most affected by failure.
- Record a baseline with its date. Use your most recent survey wave or a telemetry window, and write the date next to the number. The slip is pulling a baseline from a different period than the target, which makes every later comparison arguable.
- Set a numeric target relative to that baseline. A movement, not a mood. The slip is a target worded as better, which cannot be failed and therefore cannot be managed.
- Attach a review date and a named owner who has the authority to change operations. The slip is an objective owned by a committee, or by someone in insight who can measure a problem but not fix it.
- Choose the data source before you launch: an intercept survey, anonymised journey telemetry, or a staff incident log. The slip is choosing the source after the results arrive.
Calibrating the Target
Set whole-service targets in small, dated steps, because broad national indices crawl upward by fractions of a point between waves. A two-point jump on an entire service in one quarter is a claim someone will challenge, correctly.
Sector examples keep it honest. A retail team might target dwell time at a store entrance, moving from its own December baseline to a stated figure by the following December. A station team might target information satisfaction among disabled passengers, with separate baselines and separate review dates, because the aggregate will move before the subgroup does.
Two constraints apply to the data. Telemetry and survey responses about individuals have to meet UK GDPR requirements, including lawful basis, retention and minimisation. And any subgroup result needs a sample large enough to report, so define your minimum cell size before you promise a disability breakdown in the board pack. When you build the instrument, our notes on designing a satisfaction survey cover the question wording that survives comparison across waves.
Why Do Overall Satisfaction Scores Hide Accessibility Gaps?
A headline satisfaction score can rise while disabled passengers continue to report a worse experience. In Transport Focus's 2024 bus survey, 82% of passengers with disabilities were satisfied with their journeys, compared with 85% of non-disabled passengers. The survey covered 41,000 passengers across 39 areas of England outside London, plus 3,500 respondents in Scotland and 3,600 in Wales (Transport Focus national bus survey results). A three-point gap is easy to miss when only the overall result appears on a dashboard.
Set objectives that pair the headline score with separate results for disabled and non-disabled users, task completion, and whether reported problems are resolved. A person may rate a journey positively overall and still struggle to reach a platform or entrance independently. That gap between satisfaction and successful completion is why one score cannot stand in for the whole experience.
What the Standards Require
Accessibility is a responsibility of the service and the built environment, not a test of how resourceful an individual can be. UK service providers and venue operators need to consider their legal duties and relevant accessibility standards when setting objectives. Translate that responsibility into measures people can check: whether users can find the intended destination, complete the journey, and do so independently.
Waymap provides smartphone-based indoor and outdoor guidance without installed beacons or other venue hardware. That removes the installation and maintenance demands of fixed infrastructure, while still requiring venues to keep points of interest and maps accurate as layouts change. For visitor destinations, measures of successful arrival can inform accessible tourism planning. Operators reviewing inclusive visitor experiences can also browse historic castle event rooms.
Testing among diverse user groups at Birmingham New Street showed strong satisfaction across all groups. Users with visual impairments gave particularly positive responses and reported greater confidence navigating the station independently. Waymap, founded by Dr. Tom Pey, is designed to guide people to exact destinations using hands-free audio directions.
Which Measures Sit Beneath the Headline Score
A headline figure is a summary of a funnel, and the funnel is what you can manage.
| Measure | Role in the objective | Current reference |
|---|---|---|
| Overall rail journey satisfaction | Headline measure to hold | 84%, May 2024 Rail User Survey |
| Satisfaction with crowding | Attribute with the lowest score | 65%, May 2024, down from 72% |
| Staff helpfulness and attitude | Attribute that fell between waves | 73%, May 2024, down from 80% |
| Assistance delivered as booked | Reliability check beside satisfaction | 94% satisfied when delivered; 10% received none |
| Route completion rate | Independent arrival at the intended entrance or platform | Your own pilot baseline, split by disability and journey type |
| Information availability for disabled users | Equity check on accessible information | 39% satisfied, English bus data |
The May 2024 Rail User Survey reported 84% of passengers satisfied with their train journey overall, but only 65% satisfied with crowding and 73% with staff helpfulness and attitude. Those two attributes had fallen from 72% and 80% in the preceding report. The headline held while the experience underneath it eroded.
Reliability needs its own line, because satisfaction measured at the point of service hides complete failures. The Office of Rail and Road's accessible travel reporting found 94% of passengers were satisfied when station assistance was successfully delivered, yet 10% received none of the assistance they had booked. A passenger who never got the service was never asked the satisfaction question.
Information availability for disabled users is the quietest gap of all. In England, only 39% of disabled people were satisfied with the availability of information about accessible buses, while overall satisfaction with local bus services was 51% among disabled people and 54% among non-disabled people, per the disability and accessibility statistics for England 2023 to 2024. Aggregate service satisfaction passed while information discoverability failed.
Building the Funnel
Track five stages, each split by disability and journey type: successful arrival at the intended destination, route completion rate, assistance reliability, time to destination, and post-journey satisfaction. Venue operators can add operational counts that no survey captures well: missed turns reported at help points, staff interventions logged by front-of-house, and wayfinding complaints routed to customer services. Those counts move first, and they move before satisfaction does, which makes them your early warning. Our customer satisfaction metrics notes set out how the layers connect.
How Venues Link Navigation to Satisfaction Results
At a stadium, reaching the right seat without asking a steward is a concrete outcome to measure. Pair that task-completion rate with a dated satisfaction score, and report both by disability group. For event-day travel, track low-carbon route choices separately rather than treating them as a navigation result.
Liverpool ONE offers a retail example. In user testing, visitors successfully reached exact store destinations using Waymap. The centre's CMS also brought a significant improvement in operating efficiency. These outcomes give venues practical measures to monitor: store-finding completion in a controlled test, and staff time spent answering navigation questions over a consistent sampling period.
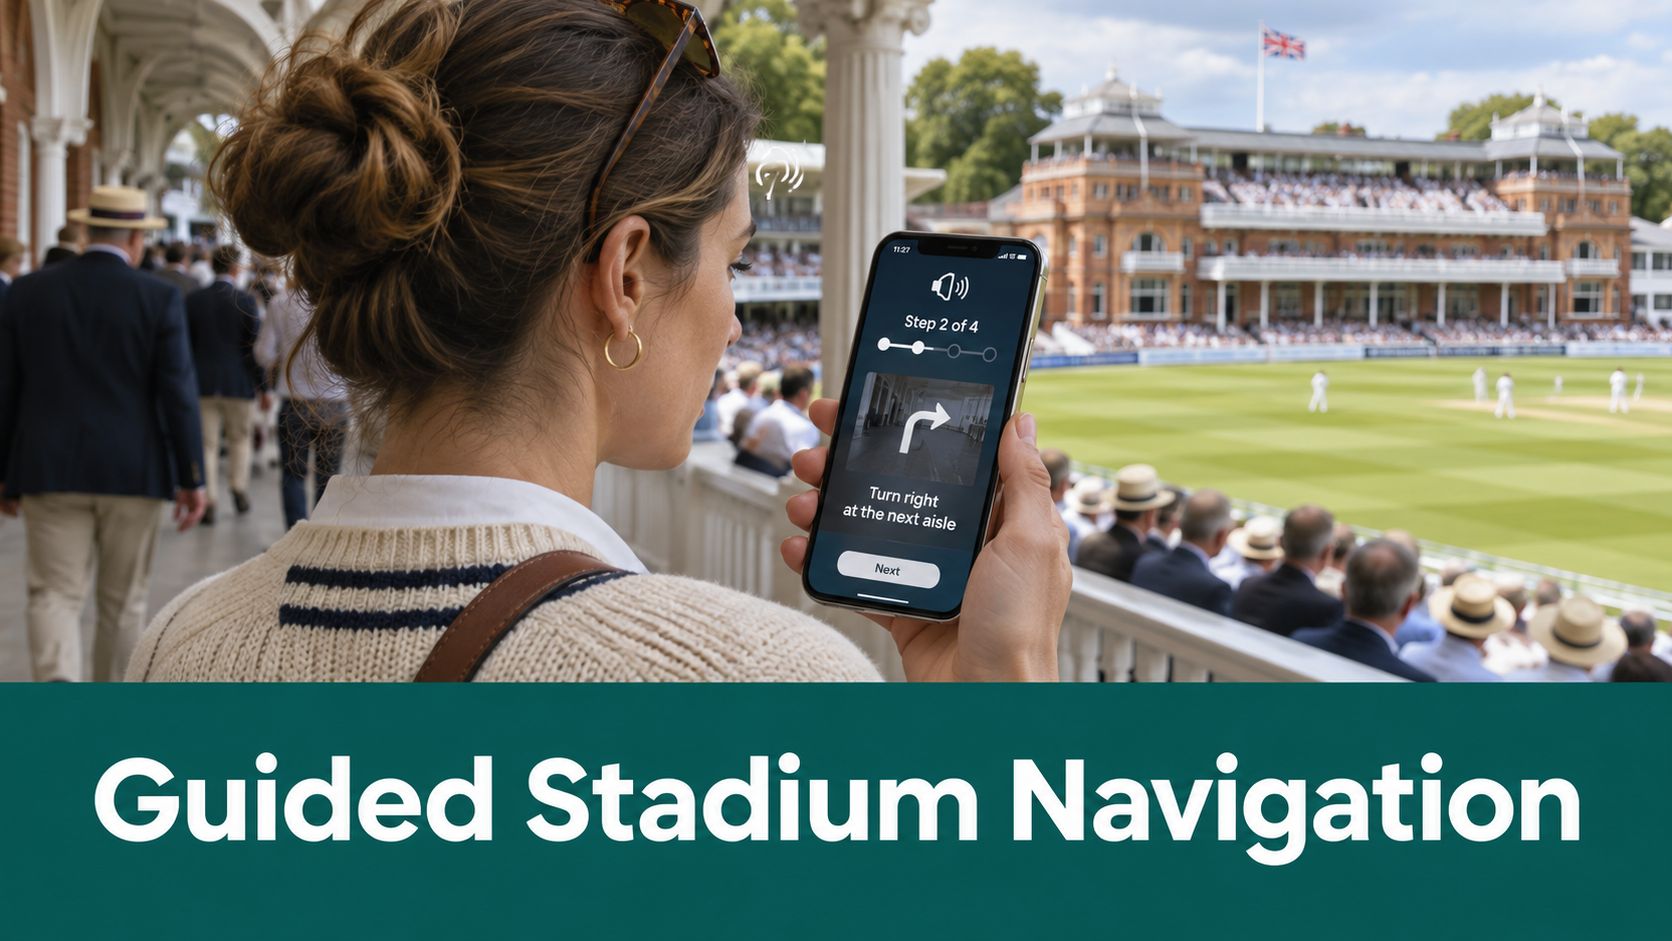
Waymap combines smartphone motion sensors with detailed maps to provide directions indoors, outdoors and underground without relying on GPS, Wi-Fi or installed hardware. For venue operators, this means points of interest can be updated through a dynamic wayfinding layer rather than maintained through installed beacons. Map accuracy and currency still matter: an outdated store or seat location can undermine otherwise clear directions.
Start by mapping the visitor's route and identifying the task's endpoint. A customer journey mapping approach can help define where completion should be recorded, such as at the correct seat, exit or store. Event organisers looking for map tips for tournament directors can consider how map detail supports route instructions, then set a baseline and a dated target for the venue task.
Which Dated Objective Should I Confirm Before Budget Review?
Confirm exactly one. One objective, dated, with a baseline you can show and a target you'd defend in a room where someone wants the money for something else.
Transport Focus reported in February 2024 that overall satisfaction with passengers' most recent rail journey had recovered to 88%, with crowding satisfaction up to 76% from 67% and punctuality and reliability up to 77% from 72% (Transport Focus rail passenger results, March 2024). Convert crowding into something dated: raising crowding satisfaction from 76% to 80% within two reporting waves. That's a comparison point, not a forecast, and its value is that it can be checked.
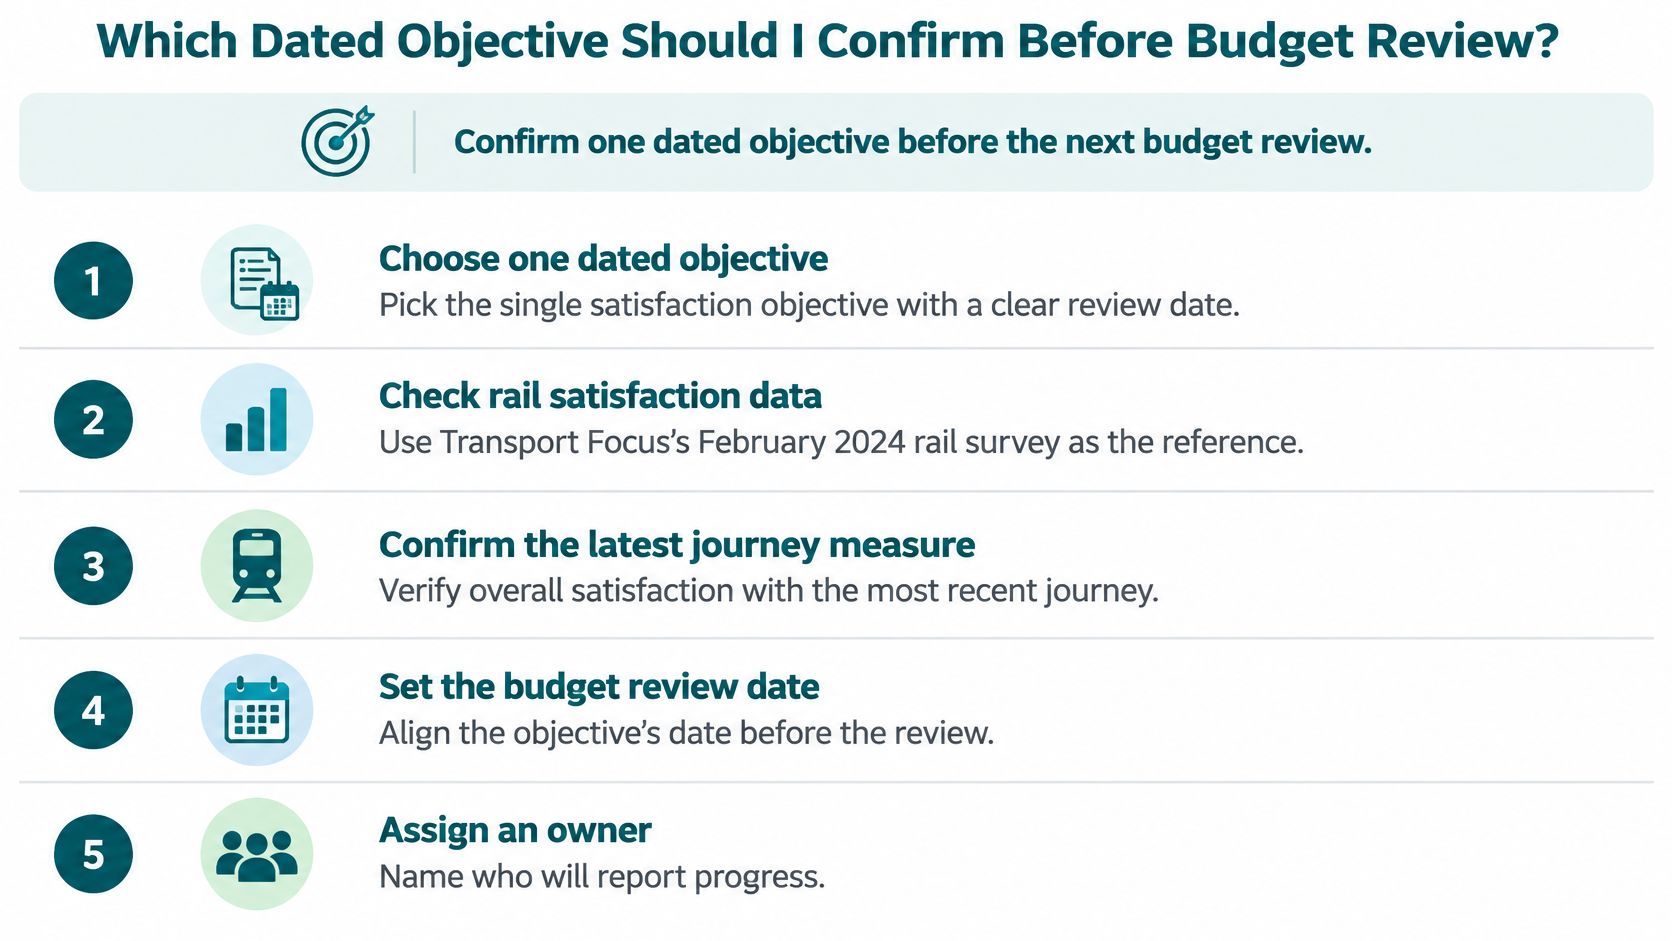
The objective has to hold five elements before the review: the experience named, the user group split by disability, the baseline with its date, the numeric target with its review date, and a named owner with the power to change operations. No owner means no objective, only a hope with a dashboard.
The friction you'll actually meet: capital approval cycles make new physical hardware politically difficult to defend, and high-footfall venues carry the operational burden of maintaining that hardware through every layout change. That's the argument for a wayfinding layer that lives on the visitor's phone rather than in the ceiling.
For retail sites the case rests on revenue and dwell time as well as compliance, because a visitor who gives up on finding a store leaves, and one who finds it spends. Our app maintenance, bug fixes and updates are carried out at non-peak times, so keeping guidance current doesn't collide with opening hours.
Questions About Customer Satisfaction Objectives, Answered
How many customer satisfaction objectives should an organisation set?
Set one headline objective and up to three component objectives per team, each with a named owner. A shorter list gives review meetings room to decide what to change, rather than read out results.
Who should own a customer satisfaction objective?
A named operational manager who can change the process should own it, with the insight team supporting measurement. Review results monthly. An insight team can report a gap, but operational ownership is needed to act on it.
How often should customer satisfaction objectives be reviewed?
Review operational measures monthly or quarterly, and check the headline target at each survey wave or annually. Set the cadence according to how quickly the measured experience can change.
Does a higher overall satisfaction score prove an objective is met?
No. Check attribute scores, differences between disabled and non-disabled users, and task completion alongside the headline. The May 2024 Rail User Survey reported an overall score of 84%, while scores for crowding and staff helpfulness fell between waves. A rising average can conceal a weaker result for a specific group or experience.
What is the difference between a customer satisfaction objective and a KPI?
An objective sets a dated target for a specific experience. A KPI is an ongoing measure used to track performance over time. When an objective expires, set a new target; keep the KPI to see whether results change.
Waymap provides indoor, outdoor and underground navigation without relying on GPS, Wi-Fi or installed hardware. Its heads-up audio instructions give step-accurate directions, and venue managers can update points of interest. Visit Waymap to see how the audio guidance and updateable points of interest work in practice.
