
Customer Satisfaction Metrics for Venues and Transit

A regional rail operator can celebrate a record customer satisfaction score while accessibility groups report that passengers still can't find step-free routes to platforms. Both statements can be true. A broad score may reflect punctual trains, clean stations, or helpful staff, while missing a broken lift, an unclear interchange, a crowded concourse, or a journey that leaves a blind passenger unable to reach the right platform independently.
That's why customer satisfaction metrics for venues and transit need an operational design. The useful question isn't only whether people felt positive. It's which journey succeeded, where effort increased, who was excluded, and what the operator can change next.
This guide covers CSAT, NPS, CES, behavioural telemetry, complaint handling, and wayfinding-specific measures. It also connects measurement to the Equality Act 2010, ADA Title III, BS 8300, and PAS 78, because accessibility performance can be a legal and service obligation, not merely a dashboard trend. Teams looking to build shared understanding before selecting measures may also benefit from facilitated connection exercises, particularly when estates, customer service, accessibility, and operations teams hold different views of the same journey.
For a practical accessibility perspective on network design, see Waymap's guidance on accessible public transport.
Why Venues and Transit Need Different Satisfaction Metrics
Retail and software teams often measure satisfaction around a defined transaction. A customer buys something, opens a support ticket, completes a digital task, or receives a post-purchase survey. The interaction has a relatively clear start and finish, and the organisation can usually change the interface or service process without altering a physical environment.
Venues and transit networks work differently. The customer journey passes through lifts, entrances, ticket barriers, platforms, concourses, corridors, staircases, gates, toilets, clinics, stands, and exits. A single obstruction can invalidate an otherwise successful interaction. A passenger may rate a ticket purchase highly and still miss a connection because the step-free route was unclear.
Physical friction changes the meaning of a score
Operators need to connect sentiment with the conditions that produced it. Common sources of friction include:
- Blocked or unavailable lifts: A route advertised as accessible may fail at the point where a passenger needs it.
- Crowded decision points: High footfall can make signs, audio announcements, and staff directions difficult to use.
- Signage gaps: A person may understand the destination but still lack reliable information about the next turn.
- Missed connections: A route that adds uncertainty or unnecessary effort can affect whether a passenger reaches a platform in time.
- Sensory overload: Noise, glare, crowd movement, and changing event conditions can make a familiar environment harder to traverse.
- Temporary changes: Closures, security controls, construction, and event layouts can make static journey assumptions unreliable.
A single CSAT question won't identify these causes. Nor will a high NPS necessarily show whether people with access requirements can complete the same journey with comparable confidence and independence.
Operational rule: Treat satisfaction as an outcome. Track the physical and behavioural conditions that explain it.
Compliance makes some measures consequential
The Equality Act 2010 creates a relevant UK context for service providers, while BS 8300 provides guidance on accessible buildings and the built environment. PAS 78 is also relevant when organisations design and manage accessible services. In the United States, ADA Title III establishes accessibility duties for places of public accommodation.
These frameworks don't turn every satisfaction score into a compliance test. They do mean that an operator shouldn't treat accessibility as a communications exercise while measuring only general sentiment. A useful programme combines customer feedback with evidence that people can complete important journeys, find the right destination, and recover when a route fails.
The Core Metrics Operators Actually Use
No single measure captures the whole experience. Operators usually need a small set of metrics with distinct jobs, clear formulas, and a defined response when performance changes.
CSAT measures the immediate interaction
Customer Satisfaction Score, or CSAT, asks how satisfied a person was with a particular interaction. Common implementations use a 1-to-5 or 1-to-10 scale, although the chosen scale must remain consistent within a reporting series. A typical percentage calculation divides positive responses by all valid responses and multiplies the result by 100.
Use CSAT after a ticket purchase, information-desk interaction, complaint response, assisted boarding experience, or venue visit. It's strong at showing whether a specific touchpoint worked. It's weak at explaining what happened elsewhere in the journey, especially when the survey reaches only people who completed the transaction.
NPS measures relationship-level advocacy
Net Promoter Score, or NPS, asks how likely a customer is to recommend the organisation on a 0-to-10 scale. Promoters are normally rated 9 or 10, passives 7 or 8, and detractors 0 to 6. The formula is the percentage of promoters minus the percentage of detractors.
NPS can help a transport authority understand broad relationship sentiment or help a stadium assess the overall event experience. It shouldn't be used as the main measure for a single lift, platform, gate, or wayfinding task. Captive audiences, limited alternatives, and event excitement can make recommendation intent look healthier than the underlying journey.
CES measures effort
Customer Effort Score, or CES, measures how easy it was to complete a task or resolve an issue. A common version uses a 1-to-7 scale, asking respondents to rate ease or difficulty. Teams should define the direction clearly because some questionnaires make a low score desirable while others make a high score desirable.
CES is particularly useful for wayfinding. Ask it after a passenger reaches a platform, a visitor finds a stand, or a patient reaches a clinic. It identifies friction more directly than a broad satisfaction question, though it still needs a follow-up reason or behavioural signal to show whether the problem came from signage, route design, staff information, or a temporary obstruction.
UKCSI and CESI support structured benchmarking
The UK Customer Satisfaction Index, or UKCSI, is a long-running UK benchmark used since 2008 across more than 275 leading UK organisations. Its 26 measures sit within five dimensions, Experience, Complaint Handling, Customer Ethos, Emotional Connection, and Ethics, with organisation scores based on customer ratings on a 1-to-10 scale. The UKCSI benchmark from the Institute of Customer Service provides historical context that local dashboards can't supply.
The index fell to 75.8 out of 100 in July 2024, its lowest level since July 2010, according to the Institute of Customer Service. That reading was 0.8 points below July 2023 and 2.6 points below the July 2022 highpoint of 78.4. Later releases recorded 77.3 in July 2025 and 78.3 in July 2026, illustrating why a shift of one or two points can matter in national service benchmarking. These figures should inform context, not replace local diagnosis.
CESI, used in contact-centre and service-desk environments, is most useful when the operator needs to assess support effort and resolution quality. It won't reveal whether a passenger could move through a concourse independently, so it belongs alongside physical journey measures.
Survey fatigue on public transport, low response rates at busy stadiums, and inflated NPS among audiences with few alternatives all make methodology part of the metric decision. Waymap's discussion of user retention metrics is relevant here because repeat use only means something when the underlying journey remains usable.
Matching Metrics to Operational Decisions
A metric earns its place when a named team can act on it. CSAT may belong to customer service, CES to journey design, NPS to relationship management, and behavioural telemetry to operations or estates. Problems arise when leaders compare the scores without linking them to ownership.
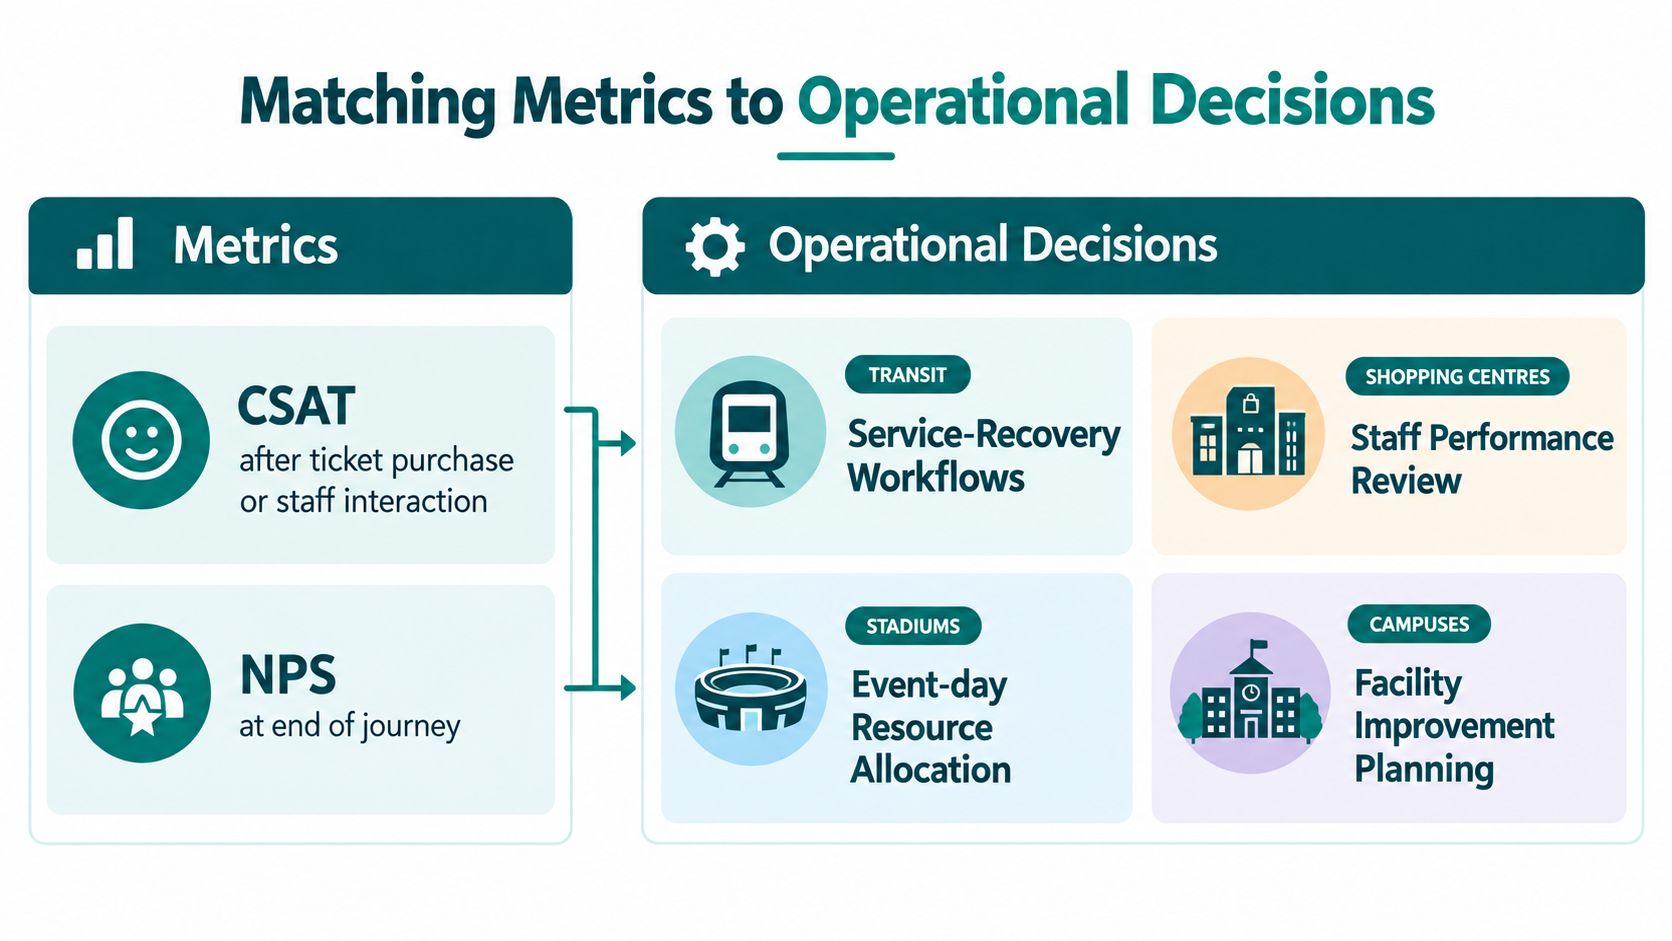
Use the score for the decision it can support
| Metric | What it tells you | What it cannot tell you | Useful operational decision |
|---|---|---|---|
| CSAT | Whether a specific interaction met expectations | Whether the wider journey worked | Trigger service recovery after a ticket, staff, or complaint interaction |
| NPS | Relationship sentiment and recommendation intent | Which physical feature caused dissatisfaction | Identify broad loyalty patterns and potential advocates |
| CES | How difficult a task felt | The exact source of the effort | Prioritise wayfinding, information, or process changes |
| Behavioural telemetry | What people did during a journey | Why a person behaved that way without qualitative context | Investigate reroutes, abandonment, dwell, and arrival outcomes |
| Complaint handling measures | Whether recovery worked after failure | Satisfaction before the incident | Assign owners, review resolution, and improve communication |
In a shopping centre, CSAT after an information-desk interaction can support a staff performance review. In a stadium, event-day CES and route-abandonment signals can inform steward deployment or temporary signage. On a campus, successful arrival at a clinic, lecture theatre, or service point can guide facility improvement planning.
NPS is more suitable at the end of a completed journey or visit than at an arbitrary point in a captive environment. A passenger may recommend a metro system while still failing to reach a step-free platform. A single-item CSAT score can also hide that failure if the question arrives after a successful purchase.
Decision test: If a score changes, identify the person who owns the next action before you put it on the board dashboard.
Operations leaders often apply the same discipline to vehicle and network data. The practical thinking behind data driven fleet decisions UK is useful here, because measurement becomes valuable when it changes allocation, maintenance, scheduling, or investigation rather than just adding another visualisation.
Collecting Satisfaction Data in Physical Environments
Physical environments require a blended collection model. Surveys capture what people say, while telemetry captures what happened during a task. Neither stream is sufficient alone.
Three collection channels cover different gaps
Intercept surveys work at gates, concourses, information desks, and exit points. Keep the question set short and ask about the interaction that just occurred. This channel can feed CSAT and CES quickly, but it may over-represent people who have time to stop, speak the survey language, or feel comfortable giving feedback in public.
Post-interaction prompts delivered by email or an app can follow a journey, visit, ticket purchase, or complaint closure. They support NPS and CES-7 when the respondent can reflect without crowd pressure. Their delay can reduce recall accuracy, and people who don't open the message disappear from the dataset.
Passive telemetry comes from the venue app, sensors, and journey system. It can reveal reroutes, dwell at decision points, route abandonment, successful arrival, and repeated directions requests. Telemetry doesn't explain emotion or intent, so teams should pair it with targeted qualitative questions rather than treating every deviation as dissatisfaction.
Waymap contributes a specific technical model to this problem. Its navigation uses dead reckoning from device-native motion sensors, operates without GPS, Wi-Fi, beacons, or installed hardware, and is designed for sub-3-metre accuracy in infrastructure-free environments. It also doesn't require pre-mapping for venues where staff turnover is high or layouts change frequently. Those capabilities matter because estates teams often can't secure capital approval for new cabling or maintain physical hardware across busy stations, hospitals, and event spaces.
| Collection channel | Best metric fit | Typical venue signal | Bias risk | Waymap contribution |
|---|---|---|---|---|
| Intercept survey | CSAT, CES | Immediate reaction at a gate or desk | Time, language, and accessibility bias | Adds task context to route feedback |
| Email or app prompt | NPS, CES-7 | Reflection after a journey or visit | Non-response and recall bias | Connects feedback to a completed route |
| Passive telemetry | Behavioural outcomes | Reroute, dwell, abandonment, arrival | Intent remains uncertain | Dead-reckoning journey data without installed infrastructure |
Join the streams before reporting
Create one event record for each journey or interaction. Include location, route or touchpoint, accessibility requirement where voluntarily provided, survey response, operational incident, and resolution status. Then apply three controls:
- Common identifiers: Link a survey to a journey or service event without exposing unnecessary personal information.
- Shared definitions: Define “successful arrival”, “reroute”, “complaint resolved”, and “accessible route” before teams publish dashboards.
- Action ownership: Assign every threshold or trend to customer service, estates, accessibility, or operations.
The discipline described in customer journey mapping helps teams place feedback at the exact moment where friction occurs, instead of averaging it across an entire visit.
Choosing the Right Primary Metric
The right primary metric depends on the operational failure you're trying to correct. A board may prefer one headline number, but an estates leader needs a measure that can defend a capital request, a regulator needs evidence of inclusive outcomes, and a station manager needs a signal that changes today's response.
| Operational priority | CSAT | NPS | CES | Behavioural telemetry |
|---|---|---|---|---|
| Complaint handling | Strong primary choice for the interaction and recovery experience | Too broad for case resolution | Useful for effort in the process | Shows delay and repeat contact |
| Loyalty and repeat visitation | Captures a recent moment | Strongest fit for relationship sentiment | Indicates friction but not advocacy | Shows return behaviour when identifiable |
| Wayfinding friction | Shows reaction after the task | Usually too distant from the task | Best primary survey measure | Verifies reroutes, dwell, and arrival |
| Accessibility compliance | Useful as supporting evidence | Weak as a compliance proxy | Shows perceived effort | Best fit for task completion and route outcomes |
Four environment profiles
Metro rail: Make CES the primary measure for step-free and interchange journeys. Keep CSAT for staff or ticket interactions and behavioural telemetry for route completion visible beside it.
Shopping centre: Make NPS primary when the priority is repeat visitation and broad destination loyalty. Retain CSAT for information services and CES for finding shops, facilities, and accessible entrances.
Stadium on event day: Make CES primary for arrival and internal wayfinding because crowd conditions change the task. Pair it with CSAT for steward interactions and telemetry for congestion, reroute, or abandonment patterns.
Hospital campus: Make behavioural telemetry primary for inclusive journey outcomes, provided governance and consent are appropriate. Keep CES for task effort and CSAT for reception or support interactions. The operational aim is not a flattering accessibility score. It's evidence that people can reach the correct service point with fewer avoidable barriers.
This matrix is a starting point, not a universal ranking. The UKCSI demonstrates why small score movements can be meaningful when measurement is consistent, while its five dimensions show that experience and complaint handling shouldn't be collapsed into one undifferentiated number. A defensible programme reports the primary metric with the two secondary signals that explain what changed.
Waymap Deployments and the Accessibility Standard Behind Them
Accessibility measurement becomes more credible when it follows a real journey through a named environment. Lord's Cricket Ground illustrates the event-day challenge. Turn-by-turn navigation can be evaluated against wayfinding failures between entrances, seating areas, hospitality spaces, and facilities, rather than inferred from general event satisfaction.
WMATA Metro presents a different constraint. Passengers need accessibility-focused navigation through a complex public transport network, and step-free route guidance sits alongside the expectations associated with ADA Title III. The relevant satisfaction question isn't whether a passenger likes the system. It's whether they can identify and follow an accessible route to the intended platform or exit.
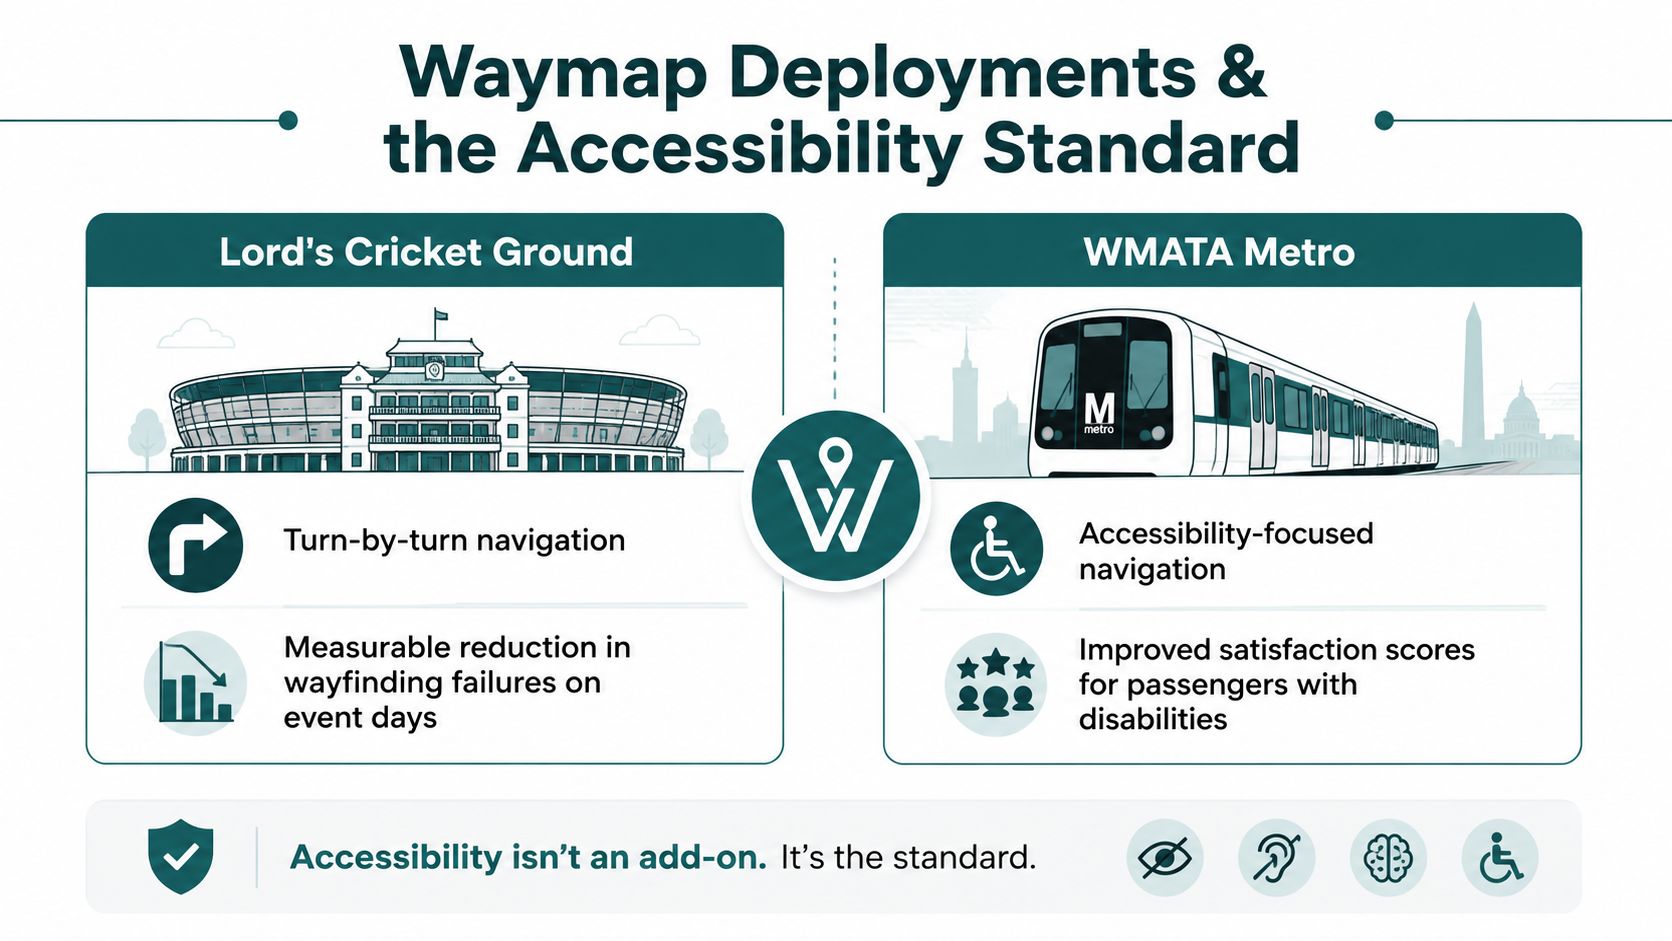
Standards turn assumptions into testable outcomes
For UK venues and transit operators, the Equality Act 2010 and BS 8300 provide important reference points for inclusive access. PAS 78 supports the design and management of accessible services. A compliance-aware metric programme should therefore measure whether people can complete defined journeys, not only whether they report positive feelings afterwards.
SBS Transit in Singapore shows why interchange support deserves its own measure. A bus-to-rail journey crosses modes, information systems, and physical spaces. CES can capture perceived effort, while route completion and successful arrival show whether the connection worked in practice.
The Royal Hospital for Children and Young People demonstrates the sensitivity of indoor healthcare wayfinding. Families may need to find a clinic, reception point, or diagnostic service across a large campus. Operators should evaluate arrival success, repeated directions requests, and post-journey effort without making medical or safety claims about the experience.
These deployments point to a broader principle. Accessibility compliance is not auditable merely because a building has a ramp, a lift, or an accessible entrance listed on a website. It becomes more defensible when an operator can connect the intended route with observed completion, reported effort, complaints, and the condition of the environment at the time.
Waymap's turn-by-turn navigation provides an example of how a dynamic navigation layer can support that evidence. For additional context on legal compliance accessibility information, operators should still take advice appropriate to their jurisdiction and service.
Practical Steps to Lift Satisfaction Scores
Improvement starts with the complaint loop, not the dashboard. Log every complaint within 24 hours, assign a named owner, and confirm the resolution in writing within 5 working days. Track first-contact resolution as a KPI, while preserving the original issue so managers can distinguish a fast answer from a genuine fix.
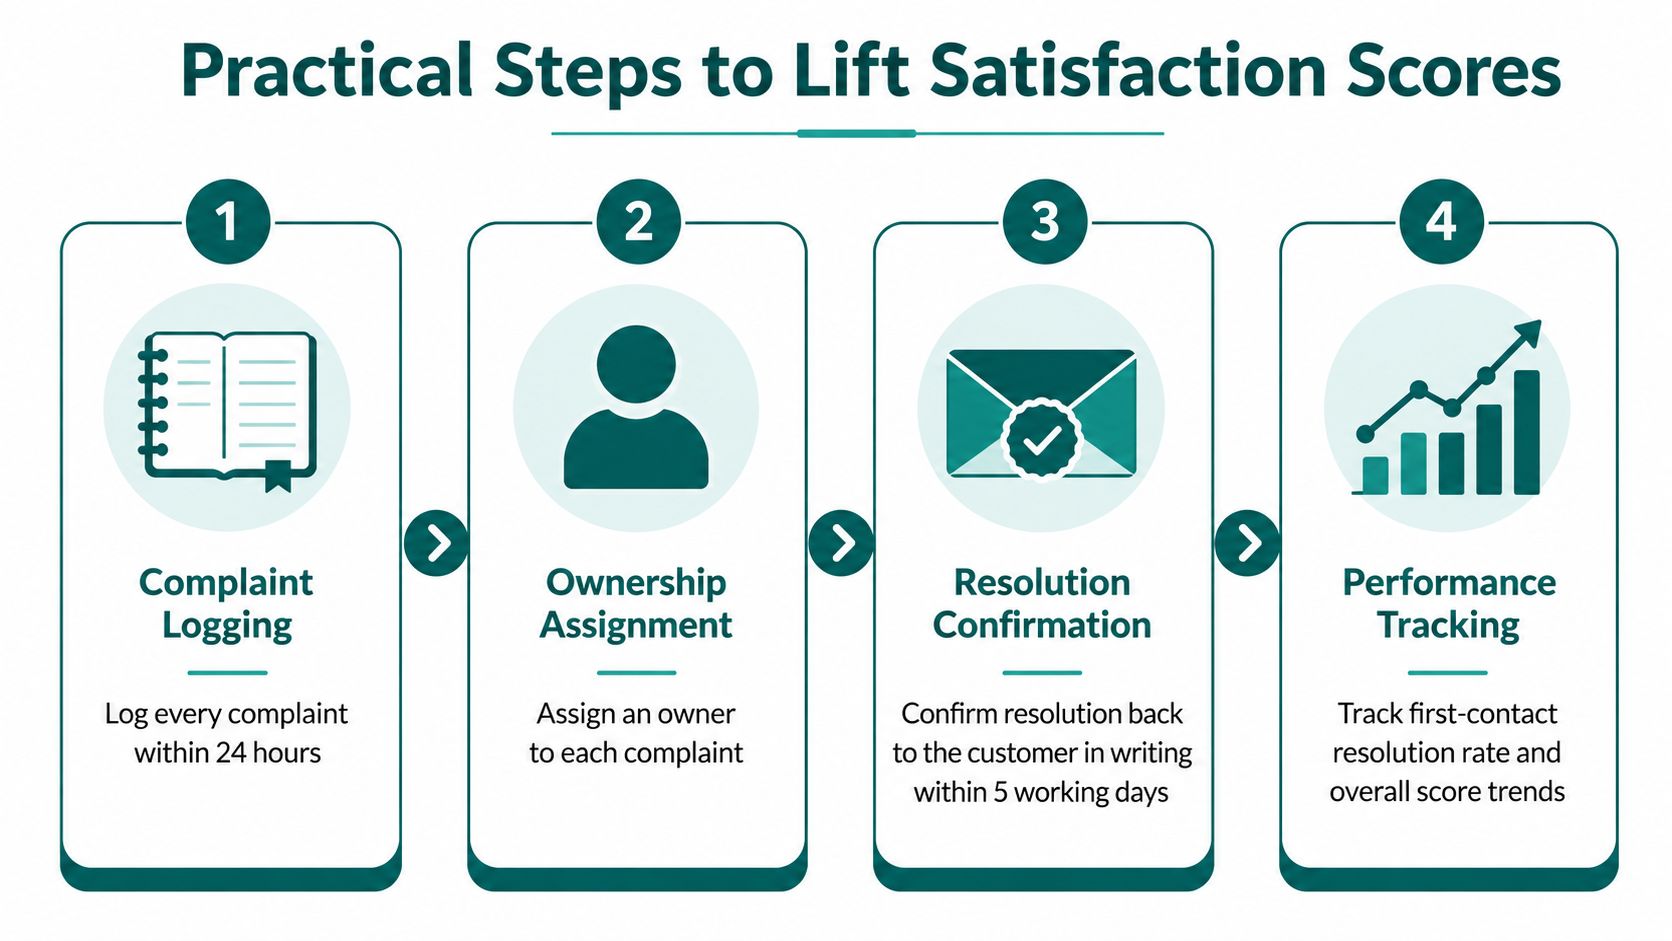
Close two loops, not one
Treat a failed wayfinding task as an operational defect. When someone abandons a route, requests directions again, or remains at a decision point unusually long, tag the location and send the issue to the estates backlog. Review the physical cause, such as a blocked lift, poor sign placement, temporary closure, or confusing junction, then confirm that the intervention changed the journey.
Product telemetry can expose friction that surveys miss. Reroute events, off-route alerts, and dwell at decision points help teams identify where to investigate. They don't replace customer interviews, but they help staff ask better questions and prioritise the locations affecting the most journeys.
Use a monthly report modelled on the transparency principles in the GOV.UK service measurement requirements. Central government digital services must publish cost per transaction, user satisfaction, completion rate, and digital take-up in open, machine-readable formats. The physical environment isn't identical to a digital service, but the discipline is transferable.
A practical cadence is:
- Data cut: Take the reporting snapshot on the first day of the month.
- Narrative: Complete the operational explanation by the seventh.
- Leadership review: Hold the decision meeting by the fourteenth.
- Public summary: Publish an accessible HTML version, with clear definitions and meaningful exclusions.
Keep the quick wins visible: audit signage at known friction nodes, brief staff on their duties under the Equality Act 2010, and place a standing feedback link in every customer channel. The user adoption strategies used for navigation services can also inform how operators explain feedback options without burdening passengers.
Frequently Asked Questions
Which single metric should a venue or transit operator track first?
Start with CSAT for transactional interactions, CES for wayfinding journeys, and NPS only after you have a mature baseline. A ticket purchase or staff interaction has a clear CSAT moment, while a platform, gate, clinic, or stand journey is better tested through effort and completion measures.
How often should satisfaction data be reported?
Report operational satisfaction data monthly and board-level trends quarterly, with a public summary in accessible HTML. GOV.UK requires live digital services to measure satisfaction continually and publish results at least monthly, while teams must identify significant patterns, test changes with real users, and keep monitoring the effect. The same cadence creates useful discipline for physical services.
How can operators measure accessibility satisfaction without tokenism?
Combine Equality Act 2010 and PAS 78 task-completion data with qualitative interviews, rather than creating a separate accessibility score that gets ignored. Segment results carefully, protect privacy, and report whether people could complete the journey, what effort they experienced, and which barriers operators removed.
What is a realistic improvement target in 12 months?
A responsible target should be based on your baseline, route type, and intervention capacity, not a generic promised percentage. Set targets for wayfinding-task completion, complaint handling, CES, and reroute rates, then validate them through named deployments such as Lord's Cricket Ground, WMATA Metro, SBS Transit, and the Royal Hospital for Children and Young People.
Waymap provides infrastructure-free, step-accurate navigation for venues, campuses, hospitals, and transit networks, using device-native sensors rather than GPS, Wi-Fi, beacons, or installed hardware. Visit Waymap to discuss how journey completion, wayfinding effort, and accessibility evidence can become part of your customer satisfaction metrics programme.
