
How to Measure User Satisfaction That Boards Trust
How to measure user satisfaction comes down to three jobs: ask for a short score, confirm whether the person actually reached where they meant to go, then compare the pattern by visitor group. A happy-or-not question on its own tells you very little.
How to Measure User Satisfaction in One View
By Tom Pey, Founder and blind accessibility technologist.
At Waymap, the order is simple: understand the client’s challenge, design a solution, put it in place, then measure results and feedback. The starting point is the decision your evidence has to support. The survey tool comes later.
For venue managers, that decision is rarely made in a vacuum:
- NHS estates teams are working within capital-spend limits that can make beacon hardware hard to approve.
- Transit operators have to keep physical kit reliable across busy sites where layouts change.
- Retail and stadium teams need proof about dwell time and demand for assistance, rather than a compliance line in a report.

Navigation is a useful test case because the intended result is concrete: reach the right door, platform or shop. In Liverpool ONE user testing, participants successfully reached exact store destinations using Waymap.
Waymap uses dead reckoning, combining the phone’s movement, direction and elevation sensors with detailed maps. It gives guidance indoors, outdoors and underground without relying on GPS, Wi-Fi or installed beacons, maintaining sub-3-metre accuracy in environments with no navigation infrastructure at all. People can download and use it free without signing up.
What Should Your Board Brief Include?
The Equality Act 2010 sets out reasonable-adjustment duties, while BS 8300 and BS EN 17210 give inclusive-design guidance for the built environment. None of these mandates infrastructure-free navigation, yet they make usable access a stronger starting point than static signs alone, including attention to step-free routes.
A good brief should fit on one view. Pair what people say with what they did, then cut the data the same way each time so the next meeting starts from evidence rather than anecdote.
Four Fields for a Board Brief
| Field | What to capture | Why it matters |
|---|---|---|
| Ask | Satisfaction and perceived effort | Records how the journey felt |
| Log | Destination reached and assistance needed | Shows whether the journey worked |
| Segment | Disabled, non-disabled and first-time visitors | Exposes gaps that averages hide |
| Repeat | Before deployment, after journeys and after changes | Turns comparisons into action |
Used together, those four fields stop a glowing score masking a failed route. They also give operations and accessibility colleagues a shared set of facts to argue from.
A positive rating is not proof of a completed journey. Measure both.
The same habit shows up in good professional development for ELT teachers: define the outcome, gather evidence, adjust the practice.
Pick one important route today, agree the destination and baseline questions, then use our customer satisfaction guide to frame the first review with operations and accessibility colleagues.
A sensible answer to how to measure user satisfaction starts with several questions rather than a single verdict. The Institute of Customer Service’s UK Customer Satisfaction Index (UKCSI) shows the shape: multiple measures across experience dimensions combined into one 0–100 score.
In January 2025, UKCSI stood at 76.1, compared with 76.0 a year earlier. A near-flat line like that should not lull anyone into stopping. It should push operators to check which experiences improved and which stayed awkward.
- Commercial relevance matters: UKCSI found 21% of customers increased spending because of the service they received.
- Local diagnosis matters too: a shopping centre, stadium or station needs to know whether visitors reached their destination and found the experience easy.
For a venue, copy the architecture rather than claiming equivalence with UKCSI. Group short questions around effectiveness, ease, trust and emotional experience, then keep each answer beside the headline index.
One shared score supports reporting. Its component answers tell operators what to fix.
Which Questions Should Follow a Route?
Aim for a questionnaire passengers can finish in under a minute. Ask “How satisfied were you with…” and use these four prompts:
| Dimension | Post-route prompt |
|---|---|
| Effectiveness | Reaching your intended door, platform or shop |
| Ease | The effort required to follow the route |
| Trust | The clarity and consistency of the audio instructions |
| Emotional experience | Your confidence during the journey |
Use 1 = very dissatisfied, 2 = dissatisfied, 3 = neither satisfied nor dissatisfied, 4 = satisfied, 5 = very satisfied.
For a simple, equally weighted venue index, calculate (mean rating − 1) ÷ 4 × 100. The five scale points become 0, 25, 50, 75 and 100.
Say the ratings come back as 4, 3, 4 and 5. They average 4, producing 75 out of 100. Treat that as an index value, rather than proof that 75% of visitors were satisfied.
Keep operational companions separate:
- Confirm whether the exact destination was reached.
- Record whether audio was understandable.
- Ask whether the visitor would use the service again.
Venues license Waymap through SaaS, while users navigate free. Assign the operator ownership of satisfaction reporting, instead of treating app store ratings as the venue’s evidence. Agree these questions with estates, ESG and operations colleagues before collecting responses.
When you're working out how to measure user satisfaction, one habit matters more than most: report disabled and non-disabled users separately. A single blended score might look reassuring, yet it can't show an operator whose journey actually failed.
England's bus evidence outside London makes the point clearly. 80% of passengers said they were satisfied with their journey in 2023, but National Travel Survey figures on local-bus provision painted a different picture: 54% satisfaction among disabled respondents against 57% among non-disabled respondents, drawn from samples of 1,157 and 4,319 respectively.
A headline figure can look healthy while the experience underneath splits cleanly along accessibility lines. The cuts below are worth publishing side by side.
Overall Score versus Accessibility Split
| Cut | What to report | Risk if omitted |
|---|---|---|
| Overall | Journey satisfaction | Conceals group differences |
| Disability | Separate ratings and samples | Hides unequal experiences |
| Environment | Indoor, outdoor, underground | Mixes concourses with interchanges |
Each of these measures answers a different question, so resist treating them as directly comparable. And a three-percentage-point gap won't diagnose missed entrances, platforms, lifts, toilets or step-free routes on its own — you need follow-up questions to uncover those barriers.
Publish the full response distribution, not just the satisfied respondents:
- Very satisfied and fairly satisfied, shown separately.
- Neither satisfied nor dissatisfied.
- Fairly dissatisfied and very dissatisfied, shown separately.

Which Accessibility Outcomes Should Accompany Satisfaction?
At Birmingham New Street, Waymap testing produced strong satisfaction across groups, with particularly positive responses from people with visual impairments who reported greater confidence travelling independently. On a measured indoor route, Waymap also delivered higher location accuracy than Apple Maps.
Deployments with WMATA, SBS Transit and Westfield London apply the same infrastructure-free model across transit and retail estates, where maintaining physical hardware across high-footfall environments carries a real operational cost.
That said, accuracy isn't the same thing as satisfaction. Ratings sit more comfortably alongside independent-travel confidence, understood audio, exact destination reached and willingness to recommend.
- Measure completion rate and requests for staff help.
- Record recalculations and time to destination within an agreed trial.
- Aggregate results without tracking named individuals across journeys.
Measure the experience of people facing the greatest barriers on its own terms.
Waymap's step-level accuracy, step-free routing, personalised step counts and individual route preferences give you concrete features to evaluate, rather than assuming every traveller needs the same route.
Before recruitment begins, use our accessibility best-practice guidance to agree your next trial's group breakdown with operations and accessibility colleagues.
Opinion scores only tell half the story. When you’re working out how to measure user satisfaction, the harder question is whether visitors actually got where they needed to go, not simply whether they enjoyed the trip.
The January 2025 UKCSI makes this plain: 26% of people needed more than one channel to complete what they set out to do, and 44% felt frustrated by security protocols or systems. Applied to navigation, that means checking whether a journey forced someone into a second app, repeated instructions or a hunt for staff help.

“Completed” needs a strict definition: reaching the exact shop, platform, room or entrance. The Liverpool ONE testing shows what this looks like in practice, with participants guided by Waymap to specific stores rather than just the general vicinity.
Three rates worth tracking:
- Completion rate is completed journeys divided by attempted journeys.
- Independence rate is journeys completed without assistance divided by attempted journeys.
- Satisfaction rate is satisfied plus very satisfied responses divided by valid responses.
Multiply each by 100. Just as important, log app switching and repeated instructions as their own figures. Otherwise an assistance-free completion can quietly paper over real friction.
Establish a Baseline and Protect Participants’ Privacy
Get your starting position on record before anything goes live. NHS Lothian did exactly this: an internal survey of 100 families found 4 in 10 needed help navigating the Royal Hospital for Children and Young People.
A pre-post evaluation of that deployment by the University of Edinburgh is underway, with results to be published and available on request. You don’t need to wait for a national figure, though. Run the same before-and-after comparison at your own venue.
- Ask about confidence, clarity, independence and mental effort straight after each route, scoring each on a one-to-five scale.
- Label every scale endpoint explicitly and never change the wording mid-trial.
- Publish those answers next to your satisfaction, completion and independence rates.
Data collection should stay proportionate to the goal. Waymap itself gathers only device model, operating system and language for bug diagnosis, while Firebase Analytics receives feature-use events alone.
On the protection side, that means encryption, pseudonymisation, access controls, audit logs and firewalls. And whatever the diagnostics show, they’re no stand-in for watching someone actually reach their destination.
A high smile score without a completion rate is not yet evidence of successful navigation.
Our user adoption guidance can help you shape the next trial: agree destination criteria with venue colleagues, then report all three rates side by side.
Trustworthy comparisons come from holding the journey steady, then asking the same questions in the same way.
How to Run a Before and After Survey Operators Trust
Before anything goes live, pin down the exact routes you will judge: hospital entrance to ward, concourse to platform, shopping centre entrance to named shop, or campus gate to lecture room. Our customer journey mapping guide helps set those boundaries cleanly.
Recruit a known group that includes blind and low-vision users, older visitors, first-time visitors and general users, and record any staff assistance from the outset.
- During trials, ask immediately after arrival, keeping the same five-point scale and the same destination definition.
- After deployment, repeat the questionnaire on equivalent journeys and publish the change.
- At busy exits, run short intercepts across comparable periods; if the layout shifts, log it rather than quietly mixing conditions.
This infographic ties survey timing, accessible participation and the three reporting metrics together.
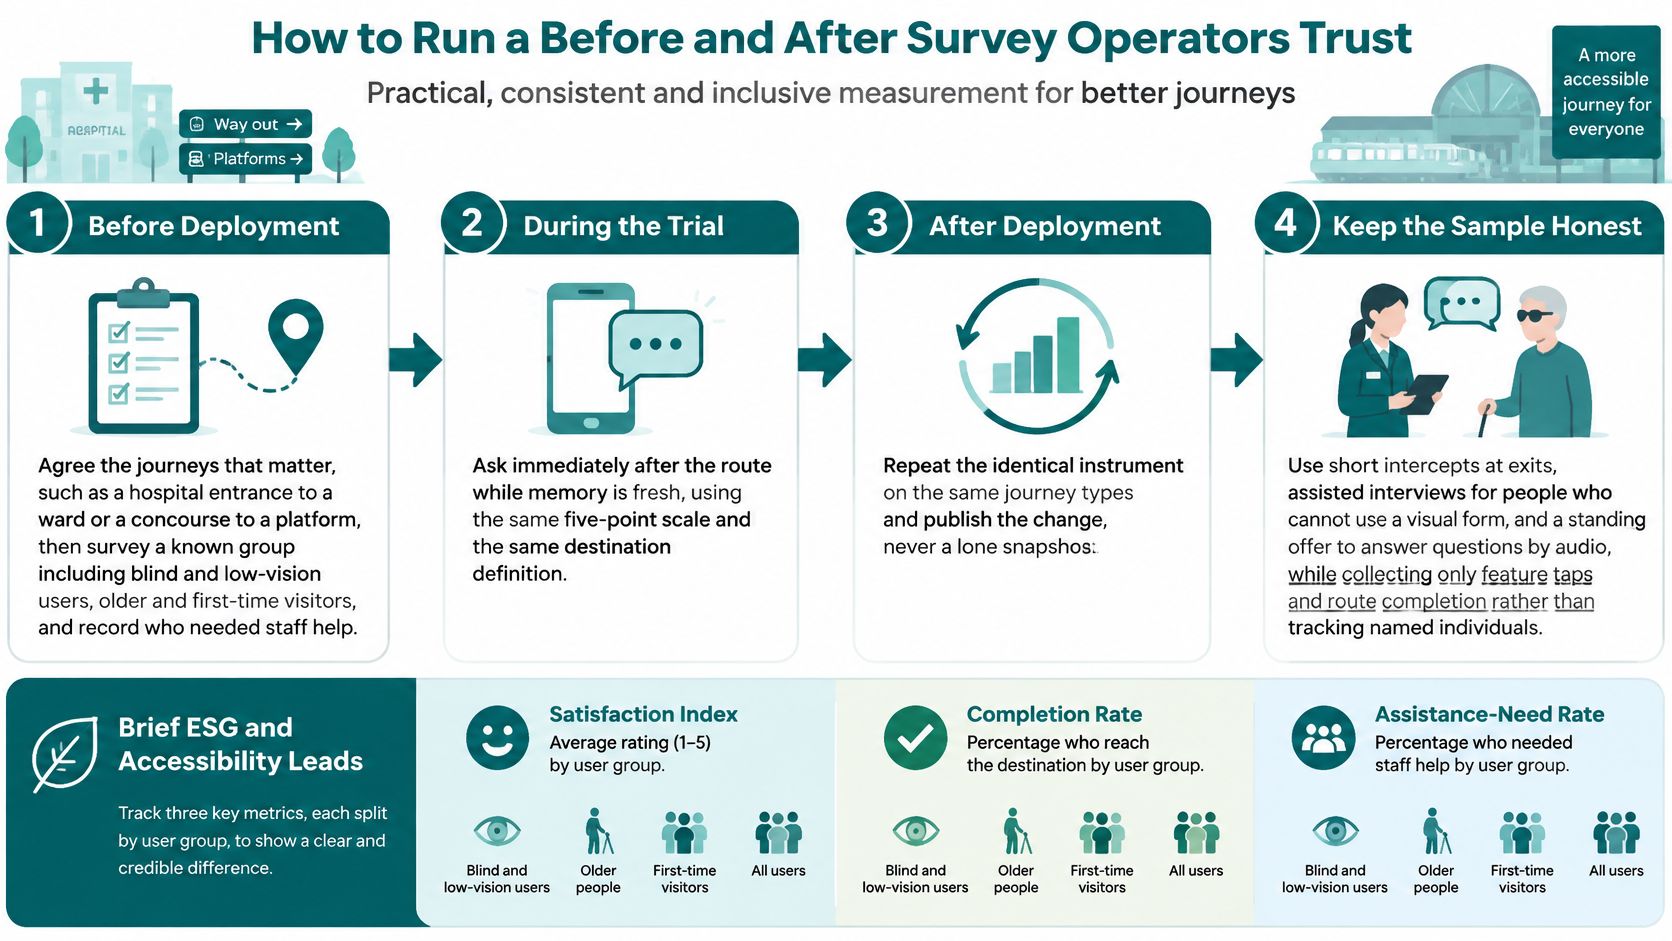
Done well, the sequence shows how to measure user satisfaction with comparable evidence rather than isolated snapshots.
Keep Interviews Accessible and Data Proportionate
Offer assisted interviews where visual forms are not usable, and keep an audio response option open throughout.
“Thinking only about your journey from the main entrance to the ward reception desk, how satisfied were you, from one, very dissatisfied, to five, very satisfied? Did you reach that desk? Did staff help?”
Collect feature taps and route completion only; named movement histories across the city are more than the question needs.
Waymap doesn't claim ownership of app submissions but holds a non-exclusive licence to use them and may delete or edit them at its discretion. Moderate comments before board reporting without suppressing criticism.
Brief ESG and accessibility leads with one satisfaction index, one completion rate and one assistance-need rate, each split by user group. Agree routes and interviewer script before recruitment begins; that is what keeps the before and after honest.
A baseline goes stale the moment the venue changes. Because Waymap lets managers amend points of interest without a hardware visit, the satisfaction story should move with the map.
Run the same questions after every layout change, new point of interest or timetable shift. Segment each wave in exactly the same way too, so a later gain for blind and low-vision users still shows up even when the all-user score looks flat.
A high general score is not proof that step-free routes work.
Before changing anything, read the dissatisfied answers against the journey type. It also helps to pair mental-effort scores with staff-assistance counts – otherwise a quiet concourse can be mistaken for an easy hospital.
Triggers That Force a New Wave
- A layout change or relocated point of interest
- A timetable or service change
- A new entrance, lift or shop opening
- A fixed calendar date, so year-on-year comparisons remain possible
Keep the questionnaire short enough that someone who has just reached a platform will finish it. Offer it in the languages the venue already serves, matching Waymap's multilingual guidance rather than inventing a new channel.
Then report to the people who can actually act: station managers on assistance demand, retail managers on whether visitors reached the shop, campus teams on first-time visitor confidence. Archive the questionnaire wording alongside each score, and steer clear of medical or safety claims. A satisfaction rise says something about navigation and confidence, nothing about clinical outcomes.
For the wider business case, see our guide on measuring cost savings from accessible navigation.
How Do You Measure User Satisfaction for Indoor Navigation?
Start with a five-point satisfaction index, then pair it with the share of visitors who reach the exact destination without staff help, split by user group.
That gives operators asking how to measure user satisfaction something sturdier than opinion alone: what people felt, and whether the journey actually worked.
What Satisfaction Metric Should a Station or Shopping Centre Use?
A 0–100 index is easier to track over time than a star rating, provided it sits alongside completion and assistance-need rates.
Follow the UKCSI-style approach explained earlier, while making clear your venue score is not an official UKCSI benchmark. Keep the calculation identical between surveys, even if the sample changes.
How Should Disabled and Non-Disabled Satisfaction Results Be Reported?
Report disabled and non-disabled results separately, with the full answer distribution and sample sizes shown side by side.
Use the earlier accessibility comparison for context. An overall average can look healthy while masking a very different experience for one group.
A strong overall score can conceal an accessibility gap.
When Should a Venue Repeat Its Satisfaction Survey?
Run the same questions before deployment, straight after trial routes, and again after layout or service changes.
Waymap’s Royal Hospital for Children and Young People evaluation results will be released when the University of Edinburgh study is published. The earlier baseline section explains the reference point.
Contact Waymap to discuss a venue trial with agreed destinations, accessible feedback options and measurable outcomes for your next operational review. For wider support reading, see helpdesk and retention resources for nutrition brands.
