
Operational Cost Savings for Venues and Transit
England's cultural infrastructure carries an estimated £7 billion repair and maintenance requirement, including about £3 billion of urgent work within five years, while the sector faces a current funding deficit of about £2 billion. The average venue maintenance budget is just under £170,000, according to the UK government's cultural infrastructure report. That makes operational cost savings a maintenance strategy, not a headcount exercise.
For venue, hospital, campus and transit leaders, the practical question is simple: which recurring tasks can be removed, reduced or planned better? Direction requests, printed-map updates, reactive signage repairs, missed appointments and inefficient pedestrian movement each create costs that return every quarter. Hardware-free navigation can help operators retire some refresh cycles rather than add another asset estate to maintain.
What Operational Cost Savings Actually Mean for Operators
Operational cost savings are reductions in recurring process and maintenance spend. They appear in the lines that finance teams review every quarter, such as staff time spent giving directions, signage replacement, reactive callouts, energy consumption and service disruption. They differ from a one-off capital reduction, such as cancelling a project, delaying a refurbishment or removing a post.
That distinction matters because deferred capital work can become future operational burden. A cheaper sign system may still require repeated surveys, artwork changes, printing, installation and disposal. A delayed accessibility upgrade may leave staff handling more assisted journeys while estates teams manage complaints, workarounds and emergency fixes.
Practical rule: Ask what the operator will stop doing every month, not only what the project will cost on day one.
Recurring spend compounds
The largest cost levers for navigation-led operational cost savings are:
- Direction-giving minutes: reception, concierge, security and station staff repeatedly interrupt planned work to guide visitors.
- Signage refresh: printed maps, notices and directional panels require updates when layouts, platforms, tenants or services change.
- Reactive maintenance: damaged, missing or outdated assets generate unplanned inspections and contractor callouts.
- Missed appointments and abandoned journeys: poor navigation can create lateness, anxiety-related enquiries and lost throughput.
- Energy and pedestrian flow: inefficient movement can increase unnecessary lift use, repeated circulation and lighting demand in zones that visitors struggle to locate.
The Waymap facilities management guidance is useful when connecting wayfinding decisions to the wider estate plan. The same discipline applies outside transport and healthcare. For example, teams reviewing how to boost vending service productivity in Oklahoma still need to examine route planning, service interruptions and avoidable staff time, not just equipment output.
Capital cuts can increase the backlog
The UK government's Infrastructure Cost Review concluded that infrastructure costs could be reduced by at least 15%, equivalent to annual savings of about £2 billion to £3 billion, or more than £20 billion over a decade, based on annual UK infrastructure construction output of roughly £15 billion. The review framed those savings as additional investment capacity, not budget cuts, and a later summary reported that its measurement programme had identified more than £3.4 billion per year in savings across infrastructure activity. The figures are set out in the Infrastructure Cost Review.
The lesson for operators is not to remove every physical asset. It's to replace repetitive, manual and duplicated work with planned processes, measurable information and updateable guidance.
The Five Cost Levers That Quietly Drain Venue and Transit Budgets
The five cost levers below appear across stadiums, hospitals and stations, but their exact share of an operating budget varies by estate. No universal percentage should be assigned without local payroll, asset and service data. A finance-grade business case should therefore record the actual baseline rather than copy a generic benchmark.
| Cost Lever | Stadium % | Hospital % | Rail Station % |
|---|---|---|---|
| Direction-giving staff time | Not established without local data | Not established without local data | Not established without local data |
| Signage refresh cycles | Not established without local data | Not established without local data | Not established without local data |
| Reactive maintenance | Not established without local data | Not established without local data | Not established without local data |
| Missed appointments or abandoned journeys | Not established without local data | Not established without local data | Not established without local data |
| Energy and inefficient movement | Not established without local data | Not established without local data | Not established without local data |
Staff time is the visible cost
A large teaching hospital may have receptionists, volunteers, porters and clinical staff answering the same location questions. At a stadium, front-of-house teams may spend event peaks directing visitors instead of managing queues. At a rail interchange, staff may repeatedly explain how to reach a platform, lift or exit.
The NHS guidance on wayfinding identifies direct savings from reducing staff time spent giving directions, alongside indirect savings from less appointment lateness and fewer anxiety-related queries. It recommends estimating both direct and indirect costs, then measuring direction-giving interactions, lateness and query volume before and after deployment. The guidance appears in Scottish NHS facilities wayfinding guidance.
Assets create work after installation
Static signs, kiosks, screens, access points and printed maps all require ownership. Their costs include surveys, content approval, mounting, inspections, repair, power, replacement and decommissioning. Transport for London's signage and display framework, valued at up to £24 million, covers design, supply, installation, decommissioning and maintenance across stations, tunnels, subways and other sites, as recorded in the TfL signage framework listing.
The decision isn't whether to buy digital or physical infrastructure. It's whether the proposed system removes work or creates another maintenance queue. The case for Bluetooth access points should be assessed against the estate's ability to power, inspect, replace and keep installed hardware current.
One intervention can move several lines
Better navigation can reduce direction requests while improving appointment punctuality and lowering the number of outdated signs that need replacement. Conversely, a poorly maintained guidance layer can create more queries, not fewer. Operators should map each intervention to the cost lines it affects and assign an owner to each measure.
An ROI Framework That Converts Cost Levers into Measurable KPIs
Finance teams approve operational cost savings when the calculation is traceable. The strongest business cases begin with an observed baseline, apply a defined unit cost and separate avoided spend from broader service benefits.
Step 1 establishes the baseline
Capture a representative operating picture before deployment:
- Direction-giving minutes per week: use staff logs, sampled shifts or short observational studies.
- Signage updates per quarter: extract changes from the asset management system and procurement records.
- Missed-appointment rate: use scheduling and attendance data where the estate includes clinics or timed services.
- Asset-refresh cycle length: record how often maps, signs, notices, kiosks and related content are reviewed or replaced.
The NHS wayfinding guidance supports this measurement logic by identifying direction-giving time, appointment lateness and query volume as relevant direct and indirect cost inputs. It also stresses that installation cost alone isn't enough for an auditable calculation.
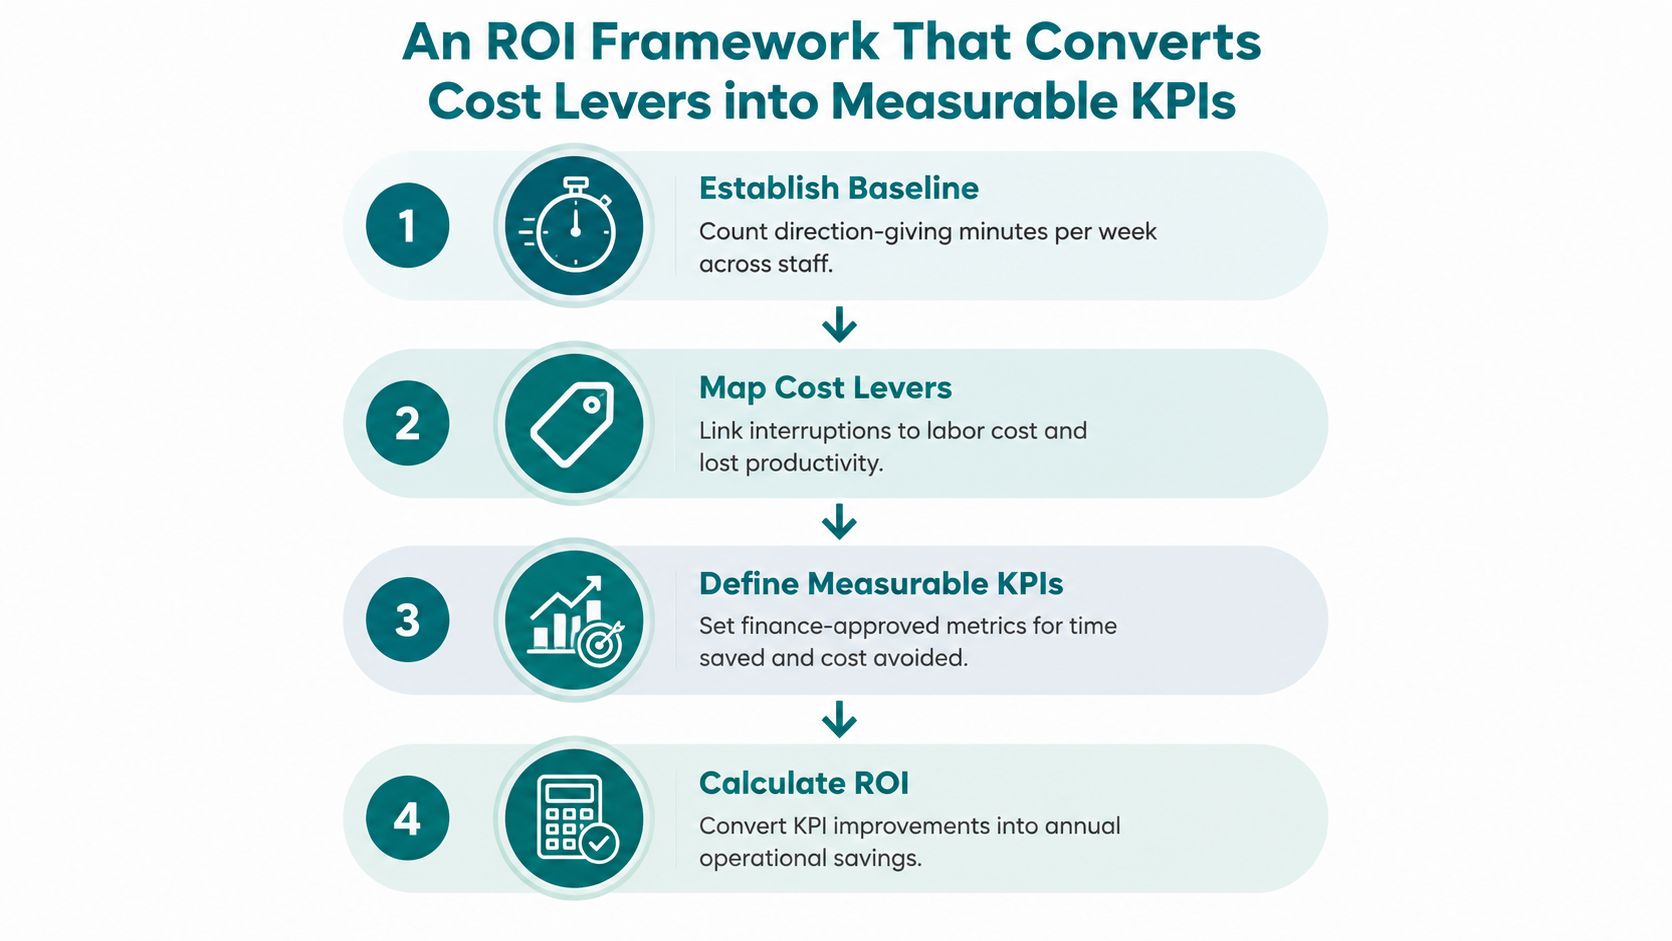
Step 2 maps the cost levers
Link each interruption to a loaded labour rate or service value. A direction request may consume a few minutes of a receptionist's time, but the operational effect can include a queue, a delayed task or a second request when the visitor still can't find the destination.
For asset changes, include design, approval, printing, installation, disposal and contractor mobilisation. For missed appointments, use the organisation's own transaction value or documented cost of unused capacity. If the value can't be evidenced, leave it out rather than inflate the return.
Step 3 defines finance-approved KPIs
Useful KPIs include:
- Direction-giving minutes per staffed shift.
- Navigation-related enquiries per visitor or passenger.
- Printed maps replenished per reporting period.
- Outdated signs removed through planned work rather than emergency callout.
- Missed appointments where navigation difficulty is recorded.
- Annual maintenance spend avoided through asset rationalisation.
A related KPI guide for property asset protection illustrates the wider principle: asset decisions become defensible when teams connect them to observable maintenance activity and ownership.
Step 4 calculates payback
Calculate annual avoided cost, subtract ongoing licence and support costs, then compare the result with deployment, integration, training and change-management spend. Keep revenue protection separate from hard savings unless finance agrees how to recognise it.
The Waymap cost-savings measurement guidance provides a useful structure for separating baseline, intervention and outcome. Don't claim a payback period until the estate has supplied its own staff rates, asset records and service data.
Hardware-Free Wayfinding vs Installed Infrastructure Cost
Installed wayfinding infrastructure can include beacons, kiosks, totems, screens, wiring, mounting points and supporting software. Hardware-free, app-based navigation removes some of those physical cost lines, but it doesn't eliminate mapping, content governance, accessibility testing or service ownership.
| Cost Line | Installed Infrastructure (£) | Hardware-Free Navigation (£) |
|---|---|---|
| Procurement and tendering | Estate-specific cost, not established without a bill of quantities | Estate-specific cost, not established without a commercial proposal |
| Civils and wiring | Estate-specific cost, not established without a survey | No beacon, kiosk, totem or screen civils where none are deployed |
| Hardware supply | Estate-specific cost, not established without an asset schedule | No installed navigation hardware |
| Installation and commissioning | Estate-specific cost, not established without site quantities | No physical navigation installation |
| Content mapping and management | Required | Required |
| Firmware, power and inspections | Required where relevant hardware is installed | No navigation hardware firmware or power estate |
| Decommissioning | Required when assets are removed | No installed navigation hardware to decommission |
| Ongoing updates | Physical and digital updates may both be required | Digital content remains subject to governance and testing |
The comparison must be honest. Hardware-free navigation still needs accurate maps, destination data, accessibility review, procurement oversight and user support. It also doesn't mean physical signs can disappear immediately, particularly where statutory, safety or emergency information requires fixed display.
The operational advantage appears when an updateable guidance layer lets an operator retire repeated map printing and sign refresh work. Waymap uses device-native motion sensors for dead reckoning, works without GPS, Wi-Fi or installed hardware, and is designed for indoor, outdoor and underground navigation. The infrastructure-free wayfinding maintenance analysis is relevant to estates teams weighing avoided hardware maintenance against the cost of managing another system.
Operators should model the whole lifecycle, not just installation. The UK government's Infrastructure Cost Review and National Audit Office evidence both point towards planned process improvement, benchmarking and better asset management as the route to durable savings.
Accessibility Standards as a Cost-Savings Lever, Not a Cost Centre
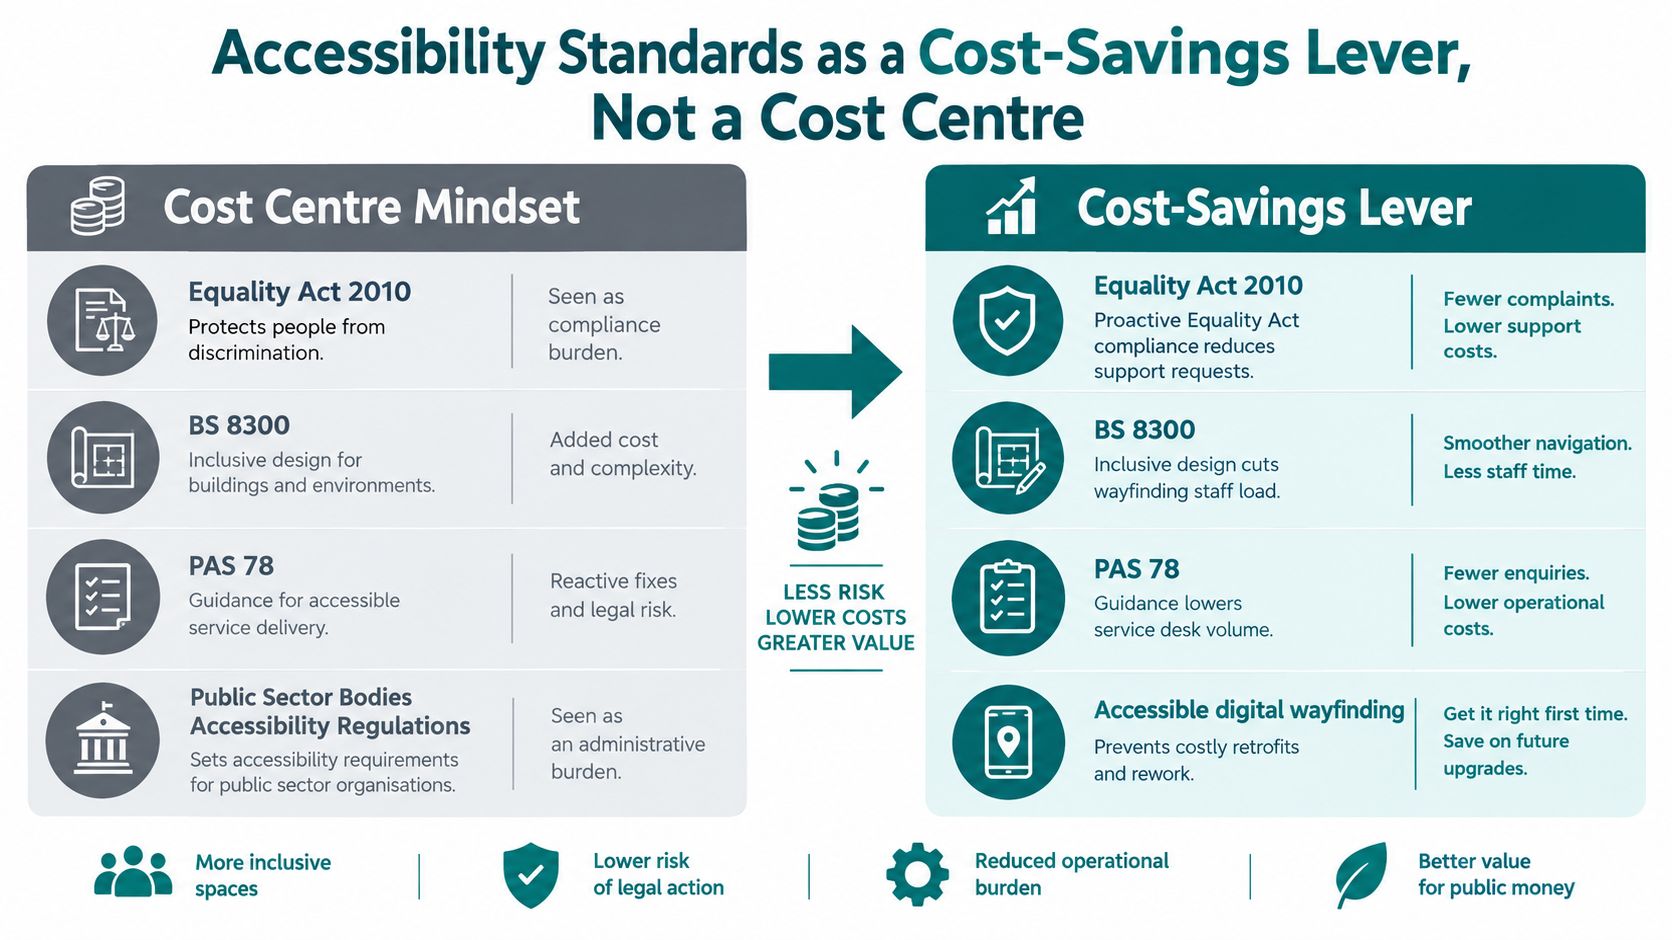
Accessibility obligations can support an operational cost case when teams connect them to the work that staff currently perform. The Equality Act 2010, BS 8300, PAS 78 and the Public Sector Bodies Accessibility Regulations each shape how organisations design, communicate and maintain accessible services. They aren't interchangeable, and digital navigation doesn't replace legal advice, physical access provision or appropriate signage.
The cost-saving opportunity comes from reducing avoidable assistance and rework. A clearly maintained step-free route can reduce escort requests. Accurate digital destination information can lower service-desk questions. Consistent route data can reduce the need to reissue directions after a lift closure, ward move, platform change or temporary diversion.
Translate standards into operating measures
| Accessibility requirement | Operational measure |
|---|---|
| Equality Act 2010 | Assisted-journey requests, complaints and reasonable-adjustment actions |
| BS 8300 | Step-free route availability, defects and staff interventions |
| PAS 78 | Accessibility review findings, content changes and service-desk volume |
| Public Sector Bodies Accessibility Regulations | Digital accessibility issues, remediation activity and user support demand |
The economic case for step-free rail access shows why sequencing matters. Investment for Britain's rail network is estimated at £2.3 billion to £5.6 billion, with a central estimate of £4.3 billion, described as 1% to 3% of total transport capital investment over the following decade. The source also estimates annual spend of £369.2 million to make England's rail network fully step-free by 2030. These figures come from WPI Economics' rail accessibility report.
The practical implication is that operators should control scope, sequence station works and avoid repeated civil-works mobilisation. A navigation layer can support that programme by directing users to the correct accessible entrance, lift and platform, while estates teams continue to deliver the physical works required.
The Waymap accessibility best practices resource can sit alongside formal compliance processes. Budget holders can defend inclusive navigation as both an access measure and a way to reduce recurring support demand, provided the organisation tracks the operational measures rather than treating accessibility as a branding statement.
Worked Examples and Case Studies in Operational Savings
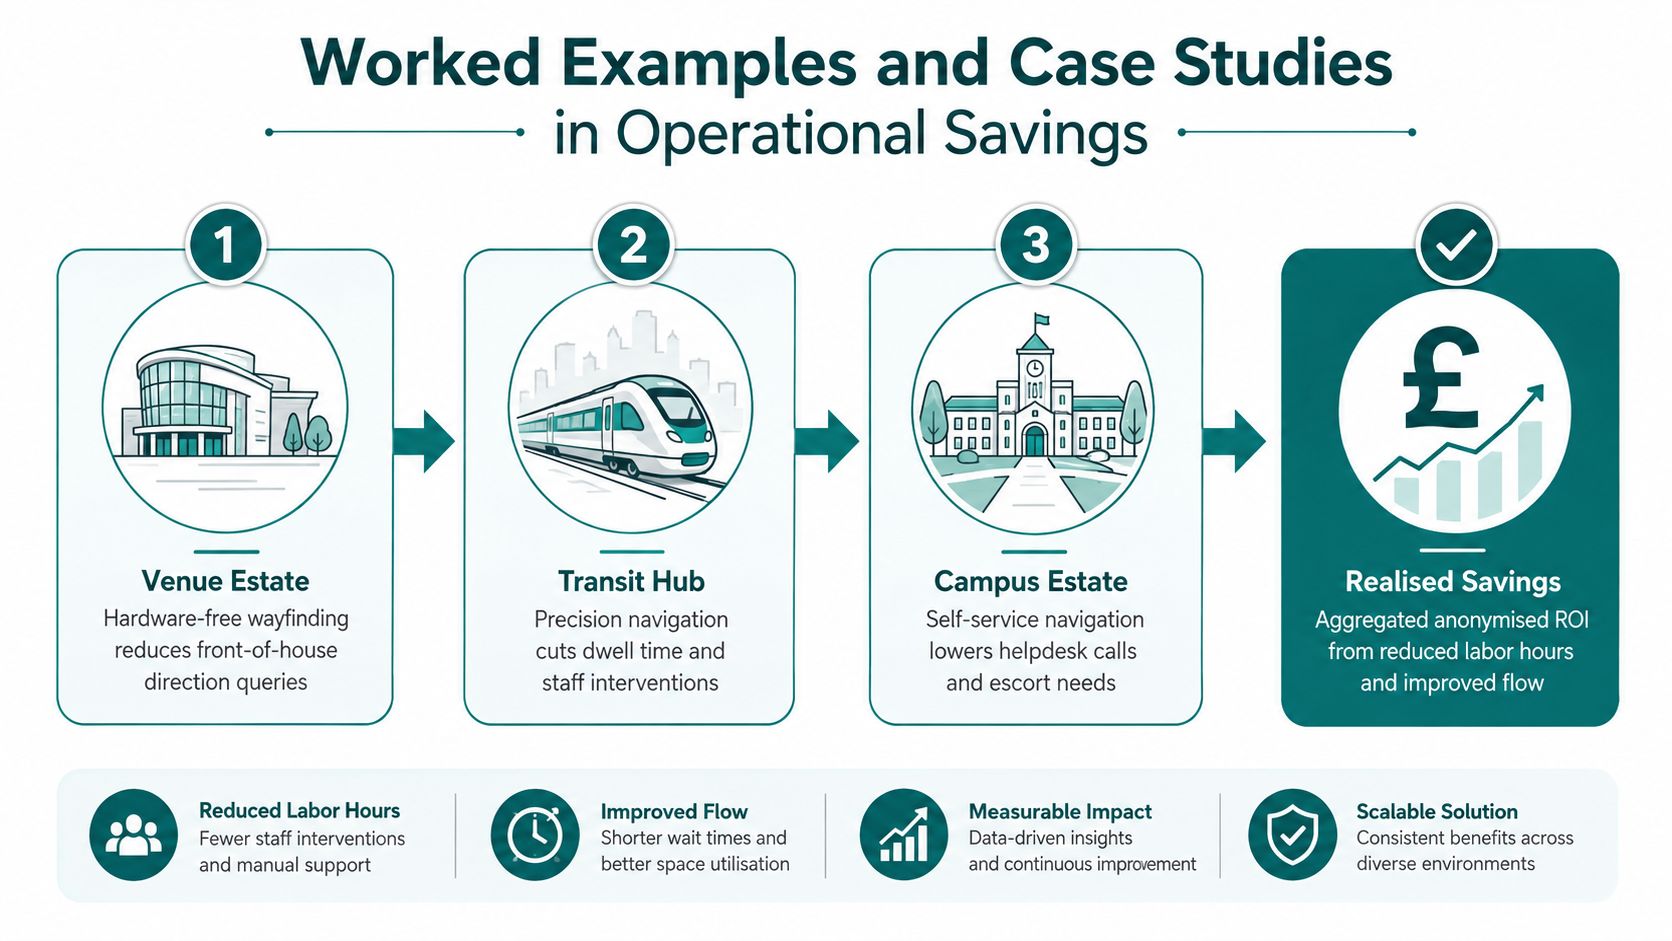
A defensible worked example must use stated assumptions, not borrowed performance claims. The following model shows how an operator can calculate the opportunity without presenting an anonymised scenario as a verified customer case study.
A large interchange can begin by counting direction-giving minutes across sampled shifts. Suppose the operator's own logs show 1,200 minutes per week spent answering route questions. That number is a planning assumption for the model, not a reported result. The finance team would multiply those minutes by the loaded hourly rate, then add documented costs for printed-map refreshes and navigation-related service interruptions.
Transit operators
For a busy station or interchange, measure:
- Direction requests by shift and location.
- Lift, platform and exit enquiries.
- Printed map changes after service or layout updates.
- Recorded late arrivals where navigation is a contributing factor.
- Staff time spent escorting passengers to step-free routes.
The operator can then compare the baseline with post-deployment results. If the navigation service reduces questions, the saving belongs in staff productivity. If it reduces printed updates, the saving belongs in the asset-refresh line. Don't count the same avoided minute twice.
Venues and arenas
A stadium can measure navigation questions during ingress, concourse movement and egress. The relevant operational outcome may be more useful deployment of front-of-house time, such as queue management, accessibility assistance or incident prevention, rather than a reduction in staffing.
An arena should also examine tenant, gate and facility changes. If each change triggers printed maps, temporary signs and staff briefings, the avoided refresh cycle may be more reliable than any forecast based on visitor satisfaction alone.
Campuses and hospitals
A campus or hospital can connect step-free route data with porter callouts, concierge interruptions and appointment lateness. The NHS guidance recommends considering direct and indirect costs, so a business case should include both staff time and schedule disruption where local records support them.
Use this reusable calculation:
Annual operational savings =
(direction-giving minutes avoided × loaded labour rate)
- printed-map and signage refreshes avoided
- documented maintenance callouts avoided
- evidenced value of recovered appointments or transactions
- measured energy savings
− annual licence, support and content-management costs.
The result should be reviewed by finance, estates, accessibility and frontline service owners. That cross-functional sign-off prevents an apparent saving in one department from becoming an unrecorded workload somewhere else.
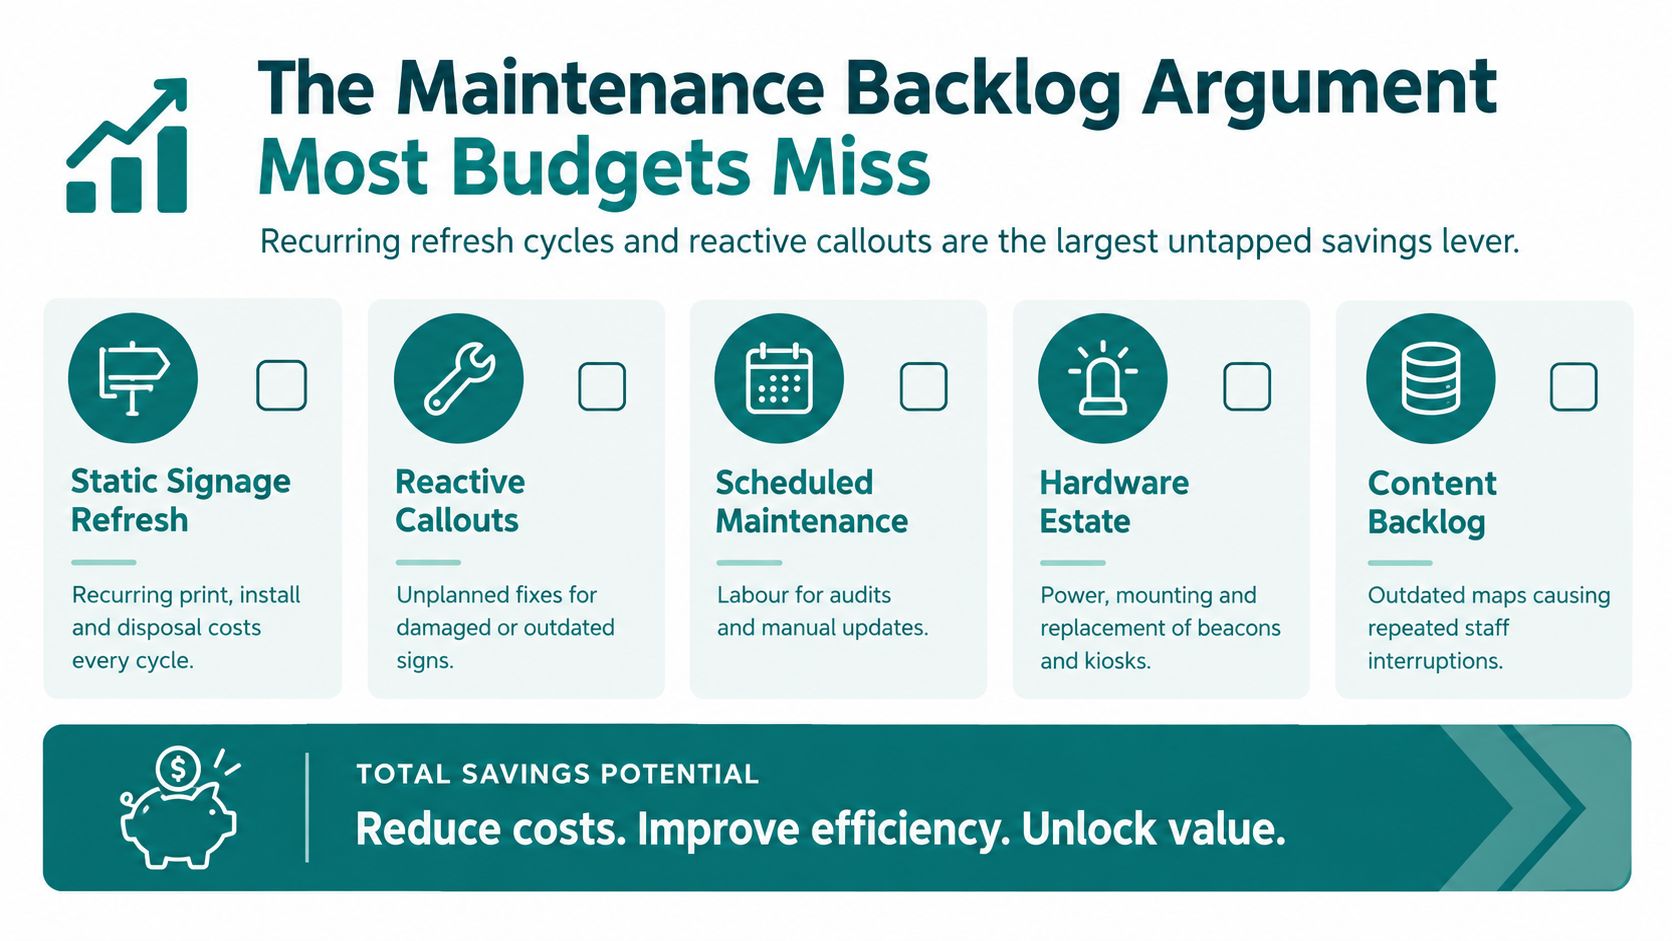
The Maintenance Backlog Argument Most Budgets Miss
The strongest operational cost argument is often not headcount. It's the work that estates teams repeatedly rebuild, repair and approve. Printed maps, replacement signs, kiosk updates, beacon battery changes, content audits and accessibility remediations each create a carrying cost when information becomes outdated.
A practical backlog review should include:
- Static signage refresh: printing, installation, disposal and artwork approval.
- Reactive callouts: unplanned fixes for damaged or inaccurate signs.
- Scheduled maintenance: labour for inspections, audits and manual updates.
- Hardware estate: power, mounting, tagging and replacement for beacons or kiosks.
- Content backlog: outdated maps that trigger repeated staff interruptions.
Operators should list every asset class, record its refresh frequency, assign a unit cost and calculate the annual carry figure. Then they should test whether a digital alternative can retire several lines without removing safety-critical or legally required physical information.
The National Audit Office found that funding certainty can deliver 10% to 20% savings for routine public infrastructure maintenance because planning reduces emergency work and inefficiency, as reported in Maintaining Strategic Infrastructure. The same evidence reports that each additional £1 invested can return at least £2.20, with some national analyses finding returns as high as £9.10. These figures reinforce the value of planned asset management, not indiscriminate cuts.
For specialised replacement parts and maintenance workflows, teams may also review MRO 3D printing solutions where appropriate. The wider question remains: what can the operator stop rebuilding? Hardware-free navigation gives estates teams a route to skip selected sign refresh cycles while continuing to meet accessibility and inclusive-design responsibilities.
The UK cultural infrastructure review also calculated that reducing a £1.6 billion sector maintenance and renewal backlog would bring mean average annual spend to £172,071 per million of asset value, according to the reported government review findings. That is why maintenance-backlog reduction belongs in the operational cost savings conversation.
Waymap provides infrastructure-free precision navigation for venues, campuses, hospitals and transit environments, using smartphone motion sensors to guide people to specific doors, platforms and points of interest without GPS, Wi-Fi or installed beacons. Visit Waymap to assess your direction-giving workload, signage refresh cycle and accessibility priorities, then build a measurable operational cost savings case around the work your estate can stop repeating.
